Lý luận của sinh viên thống kê khi so sánh các phân phối dữ liệu - Matthew Ciancetta
Luận văn số 07 của Ciancetta: Phân tích chuyên sâu, khám phá các khía cạnh độc đáo. Tìm hiểu ngay để mở rộng kiến thức.
Mathematics Education
Luan An
Luận án tiến sĩ
Năm xuất bản
Số trang
439
Thời gian đọc
1 giờ 6 phút
Lượt xem
0
Lượt tải
0
Phí lưu trữ
60 Point
Tổng quan nhanh
- Chủ đề:
- 1. Ciancetta Dissertation on Comparing Distributions of Data
- Số trang:
- 439 trang
- Trường:
- Portland State University
- Chuyên ngành:
- Mathematics Education
- Tác giả:
- Matthew Alan Ciancetta
- Năm:
- 2007
Tóm tắt nội dung luận án
I. Ciancetta Dissertation on Comparing Distributions of Data
Matthew Ciancetta wrote a doctoral dissertation on statistics education. The study examined how statistics students reason when comparing distributions of data. The dissertation was submitted to Portland State University. It earned the degree of Doctor of Philosophy in Mathematics Education in 2007. The ciancetta dissertation addresses a central topic in statistics education. Students must compare data sets in many real-world situations. The research documents the reasoning strategies students use. It tracks how those strategies develop. The study contributes to mathematics education research. It offers a framework for understanding student responses. The ciancetta phd thesis uses surveys and interviews. The methods capture both broad patterns and deep individual thinking. The dissertation includes six data comparison tasks. Each task tests a different aspect of statistical reasoning. The findings describe a range of reasoning levels. Those levels move from simple local comparisons to global distributional thinking. This research helps teachers recognize student reasoning. It also helps researchers design better assessment tasks. The dissertation is a landmark study in statistics education.
1.1. Research Purpose and Scope
The purpose of the ciancetta dissertation was clear. The study investigated student reasoning during data set comparison. It explored how students make informal inferences. It examined how students compare distributions of data. The research sought to expand an existing interpretive framework. The framework came from Shaughnessy and colleagues. The study also tested a new structure for coding responses. Six groups of students participated. The groups differed in statistical background. The study tracked reasoning across multiple tasks. Each task presented two data sets for comparison. Students explained their decisions in writing. Some students took part in follow-up interviews. The scope included both survey data and interview data. The combination provided a full picture of student thinking.
1.2. Structure of the Dissertation
The ciancetta dissertation follows a standard academic structure. Chapter 1 introduces the research problem. It presents the idea of a data set as a distribution. It explains why comparing data sets matters. Chapter 2 reviews the relevant literature. It covers intuitive strategies and variation reasoning. It also describes prior frameworks. Chapter 3 explains the methodology. It details the survey tasks and interview protocol. Chapter 4 presents the results and analysis. It refines the interpretive framework. Chapter 5 discusses the conclusions. It states limitations and implications. The appendices include survey texts and consent forms. The dissertation is complete and clearly organized.
1.3. Significance of the Study
The study matters for several reasons. It provides a detailed map of student reasoning. Teachers can use the map to interpret student work. The framework helps identify reasoning levels. It shows where students struggle. It reveals how students grow. The findings support better curriculum design. The tasks themselves are useful teaching tools. They are simple to administer. They produce rich responses. The ciancetta phd thesis also informs assessment. It suggests ways to evaluate reasoning, not just answers. The research advances statistics education theory. It connects practice, assessment, and theory.
II. How Students Reason About Data Distributions and Variation
Chapter 2 of the ciancetta dissertation reviews the literature. The review covers how students reason about data. It addresses intuitive strategies and formal reasoning. Comparing data sets is a complex skill. Students use a mix of strategies. Some strategies are productive. Some strategies are limited. The literature shows predictable patterns. Students often focus on single values first. They may compare only centers. They may ignore spread. More advanced students see the whole distribution. They reason about shape, center, and spread together. Variation is a key concept. Students must acknowledge variation to reason well. The ciancetta phd thesis builds on this literature. It synthesizes prior frameworks. It proposes a more detailed framework. The framework captures reasoning development across tasks.
2.1. Intuitive Strategies in Data Comparison
Research shows students rely on intuitive strategies. These strategies appear before formal instruction. Watson and Moritz documented these strategies. They interviewed students comparing data sets. The strategies range from simple to complex. Some students compare individual data points. Others compare whole groups. Intuitive strategies shape student answers. They also affect how students understand statistics. The ciancetta dissertation examines these strategies closely. It looks for patterns across tasks. It connects intuitive reasoning to formal reasoning. The goal is to describe a developmental path. That path leads from intuition to distributional thinking.
2.2. Understanding Variation When Comparing Data
Variation is central to statistical reasoning. The literature stresses its importance. Students struggle to acknowledge variation. They often expect exact answers. They may see two data sets as different when they overlap. The study reviews research on variation. It shows how variation reasoning develops. Students move from ignoring spread to using it. They learn to compare distributions, not just numbers. The dissertation tasks require variation thinking. Students must decide if data sets differ. That decision depends on spread and overlap. The framework captures this growth. Variation reasoning marks higher framework levels.
2.3. Reasoning About Distributions
Distributional reasoning is the goal. Students at this level see data as a whole. They think about shape, center, and spread. They use proportional reasoning. The literature defines several frameworks. Bakker and Gravemeijer described one framework. Watson and Moritz described another. Shaughnessy and colleagues built a lattice structure. The ciancetta dissertation extends these ideas. It creates an expanded lattice structure. The framework has distinct levels. Each level reflects a way of seeing data. The highest levels reflect global distributional thinking. The study tests the framework across six tasks.
III. Ciancetta PhD Thesis Framework for Data Comparison Tasks
The ciancetta phd thesis centers on an interpretive framework. The framework classifies student reasoning. It builds on prior work by several scholars. Shaughnessy and colleagues created the original structure. Watson and Moritz proposed a sequence of strategies. Bakker and Gravemeijer described distributional reasoning. The dissertation merges these ideas. The result is an expanded lattice structure framework. The framework has five main levels. The levels range from idiosyncratic to distributional. Each level describes a different reasoning type. The framework helps researchers code responses. It also helps teachers understand students. The study refines the framework with data. Six tasks and interviews provided evidence. The final framework is more precise and useful.
3.1. Existing Interpretive Frameworks
Several frameworks guided the research. Shaughnessy and colleagues built an initial framework. They later developed a lattice structure. The lattice maps reasoning levels. Watson and Moritz identified response strategies. They studied intuitive strategies in interviews. Bakker and Gravemeijer focused on distribution reasoning. Each framework has strengths. Each also has gaps. The ciancetta dissertation compares these frameworks. It notes where they agree. It identifies where they diverge. The review justifies the need for expansion. The goal is a framework that fits survey data too.
3.2. Expanded Lattice Structure Framework
The expanded framework is a key contribution. It extends the original lattice structure. It adds detail at each level. The framework has five broad levels. Level 1 is idiosyncratic reasoning. Level 2 is local reasoning. Level 3 is transitional reasoning. Level 4 is initial-distributional reasoning. Level 5 is distributional reasoning. Each level has subtypes. For example, transitional reasoning has subtypes. Those subtypes include shape, center, and variation. The framework captures more nuance. It was refined using survey responses. Inter-rater reliability was established. The framework is reliable and detailed.
3.3. Framework Levels for Coding Responses
The framework supports systematic coding. Each response is assigned a level. Cross-task numeric codes track consistency. A student may shift levels across tasks. The shifts reveal learning and task effects. Descriptive statistics can change reasoning. Tasks with statistics produce higher levels. Tasks without statistics show intuitive levels. The coding scheme is transparent. Examples illustrate each level. Idiosyncratic responses are unique and unclear. Local responses focus on single features. Transitional responses mix ideas. Initial-distributional responses show partial global views. Distributional responses use full global reasoning. The codes connect survey and interview data.
IV. Survey Tasks in Ciancetta Dissertation Data Analysis
The methodology of the ciancetta dissertation is rigorous. The study used both surveys and interviews. Researchers developed six data comparison tasks. Each task presented two data sets. Students compared the data sets in writing. Some tasks included descriptive statistics. Some tasks did not. The design tested the effect of statistics. Participants came from six groups. The groups varied by statistics background. A pilot study refined the tasks first. The interview protocol explored individual thinking. Six interviewees provided detailed responses. Cross-task numeric codes enabled comparison. The methods produced rich, structured data. The data supported framework refinement.
4.1. Data Set Comparison Survey Tasks
The survey included six tasks. Task 1 was the Yellow/Brown task. Task 2 was the Movie Wait-Time task. Tasks 3 and 4 used the Pink/Black data. Task 3 had no descriptive statistics. Task 4 had descriptive statistics. Tasks 5 and 6 used the Ambulance data. Task 5 had no descriptive statistics. Task 6 had descriptive statistics. The design compared decisions. It measured the impact of statistics. Each task asked students to compare groups. Students wrote reasons for their answers. The tasks are reproduced in the appendix. They are easy to reuse in teaching.
4.2. Interview Protocol and Subjects
Six students took part in interviews. The interviews followed the survey tasks. The protocol explored reasoning in depth. Interviewers asked students to explain choices. They probed the meaning of statistical terms. Each interview covered all six tasks. The six interviewees had different backgrounds. The analysis compared their responses. Interview data added depth to survey data. It revealed reasoning behind codes. It showed how students understood terms. Terms like average and spread were examined. The interviews validated the framework. They also exposed gaps in understanding.
4.3. Cross Task Numeric Coding
The study used numeric codes across tasks. Each response received a framework code. The codes allowed quantitative analysis. Distributions of codes were compared by group. Comparisons were made across tasks. The coding also tracked shifts. A student could move up or down levels. Descriptive statistics often raised levels. The analysis included inter-rater reliability. Two raters coded the responses. Reliability was strong. The coding system worked across all tasks. It supported the main findings. It connected individual interviews to group surveys.
V. Research Findings on Statistics Students Reasoning Levels
Chapter 4 presents the results of the ciancetta dissertation. The findings are detailed and systematic. Survey results are reported by task. Interview results are reported by case. The framework held up well across tasks. Group differences appeared clearly. Students with more statistics background reasoned at higher levels. Descriptive statistics changed student reasoning. Tasks without statistics produced more intuitive answers. Tasks with statistics produced distributional answers. The interview analysis confirmed the survey patterns. The findings support the expanded framework. They also reveal teaching implications.
5.1. Yellow Brown and Movie Wait Time Results
Task 1 was the Yellow/Brown task. It asked students to compare two distributions. Responses spread across framework levels. Most students used local or transitional reasoning. Fewer students reached distributional reasoning. Task 2 was the Movie Wait-Time task. It produced similar patterns. Group differences were visible. Students with more coursework scored higher. The tasks showed a clear progression. Reasoning levels varied by statistical background. The results validated the coding scheme.
5.2. Pink Black Tasks With and Without Statistics
Tasks 3 and 4 used the same data. Task 3 omitted descriptive statistics. Task 4 included them. The comparison was revealing. More students reached higher levels in Task 4. The presence of statistics helped students. It shifted responses toward distributional reasoning. The 1-GS and 1-SE groups both improved. The pattern was consistent across groups. Decision shifts were documented. The results show the power of descriptive statistics. They also show that students need support.
5.3. Ambulance Tasks and Interview Findings
Tasks 5 and 6 used Ambulance data. The design repeated the statistics comparison. Results matched the Pink/Black pattern. Descriptive statistics raised reasoning levels. Interview data added detail. The six interviewees showed varied reasoning. Their understanding of statistical terms varied. Some defined terms loosely. Others used terms precisely. Cross-case analysis revealed common themes. Interviewees often shifted codes between tasks. The interviews confirmed survey findings. The evidence was consistent across methods.
VI. Implications of the Ciancetta Thesis for Statistics Teaching
Chapter 5 concludes the ciancetta dissertation. The discussion connects findings to theory. The research goal was to expand the framework. The expansion succeeded. The refined framework is more detailed. It covers more response types. The study also answered the research questions. Findings show clear patterns in reasoning. The chapter addresses limitations honestly. The sample was limited to specific groups. The tasks were limited in scope. Implications for teaching are practical. Teachers can use the tasks in class. They can use the framework to assess reasoning. Future research directions are suggested. The dissertation ends with a strong contribution to statistics education.
6.1. Refining the Interpretive Framework
The framework refinement is a core outcome. The expanded lattice structure was tested. Data from six tasks guided changes. The framework now fits survey responses well. It also fits interview data. Refinements added subtypes to levels. New numeric codes improved precision. The framework is easier to apply. It supports reliable coding. It captures student growth over time. The refined framework is ready for classroom use. It is also ready for further research.
6.2. Limitations of the Research
The study has limitations. The participant pool was limited. Participants came from one university setting. The tasks were artificial. Real-world data may differ. The number of interviewees was small. Six students cannot represent all learners. The framework may not fit every context. Written responses limit detail. Interviews add depth but take time. The cross-task codes simplify complexity. These limits should guide interpretation. They also point to future work.
6.3. Implications for Future Research and Teaching
The implications are practical. Teachers should use comparison tasks regularly. The tasks reveal student thinking quickly. Teachers should provide descriptive statistics. Statistics support higher reasoning. Teachers should listen for reasoning language. Terms like spread and shape matter. Researchers should test the framework elsewhere. They should study more student groups. They should explore longitudinal growth. The ciancetta dissertation opens many paths. Its tools are ready to use. Its framework is a lasting contribution.
Tải xuống file đầy đủ để xem toàn bộ nội dung
Tải đầy đủ (439 trang)Trích đoạn nội dung luận án
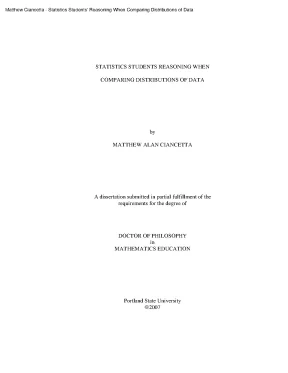
Tải xuống để đọc toàn bộMatthew Ciancetta - Statistics Students’ Reasoning When Comparing Distributions of Data STATISTICS STUDENTS REASONING WHEN COMPARING DISTRIBUTIONS OF DATA by MATTHEW ALAN CIANCETTA A dissertation submitted in partial fulfillment of the requirements for the degree of DOCTOR OF PHILOSOPHY in MATHEMATICS EDUCATION Portland State University ©2007 TABLE OF CONTENTS: List of Tables .iv List of Figures. Global Views of Data. 11 Data set as a Distribution. 12 Comparing Data Sets.
17 Chapter 2: Literature Review and Framework. 21 Intuitive strategies when predicting and making informal inferences when comparing data sets. 22 Acknowledgment, understanding and reasoning about variation when comparing data sets. 41 Reasoning About Distributions.
58 Literature Review Discussion. 75 Initial Framework by Shaughnessy and Colleagues. 77 Lattice Structure Framework By Shaughnessy and Colleagues. 79 Framework by Watson and Moritz.
81 Framework by Bakker and Gravemeijer. 82 Expanded Lattice Structure Framework. 93 Subjects and Data Collection. 99 Task Development: Data Set Comparison Survey .110 Task Development: Interview Protocol .119 i Chapter 4: Framework Refinement, Results and Analysis .121 Refinement of the Expanded Lattice Structure Framework .144 Cross Task Numeric Codes.147 Framework Refinement Summary .154 Survey Results by Group.155 Survey Results: Task 1, the Yellow/Brown task .157 Survey Results: Task 2, the Movie Wait-Time task .165 Survey Results: Task 3, Pink/Black survey task.172 Survey Results: The Pink/Black task – Without descriptive statistics (Task 3) vs.
With descriptive statistics (Task 4) .179 Survey response summary: Pink/Black tasks without and with descriptive statistics .204 Survey Results: Task 5, Ambulance task .205 Survey Results: The Ambulance task – Without descriptive statistics (Task 5) vs. With descriptive statistics (Task 6) .212 Survey response summary: Ambulance tasks without and with descriptive statistics .231 Survey Responses: Cross Task Numeric Codes .237 Analysis of Interviews.237 Background of the six interviewees………………………………………….237 Cross case analysis of interviewees.240 The interviewees’ understandings of statistical terms.241 Responses to task 1: the Yellow/Brown task.251 Responses to Survey task 2: the Movie-Wait-Time task.258 Responses to task 3 and task 4: the Pink/Black task – Without descriptive statistics and With descriptive statistics.266 Responses to task 5 and task 6: the Ambulance task – Without descriptive statistics and With descriptive statistics.296 Summary of Cross Task Numeric Code assignment.323 Chapter 5: Discussion and Conclusion.328 Research Goal: Expand and refine the interpretive framework.334 ii Research Question 2.337 Limitations of the research.342 Implication for future research and teaching.349 Appendix A: Informed Consent forms.358 Appendix B: Text version of survey tasks.361 Appendix C: Detailed survey results .368 iii LIST OF TABLES: Table Page 1. Response strategies for two ‘comparison of data sets’ interviews, by Watson and Moritz. Course enrollment of participants.
Participants’ Major Fields of Study. Statistics backgrounds of the participants. Educational Level breakdown: Counts of each group. Pilot Study results.
Examples of Idiosyncratic type responses. Distribution of Idiosyncratic responses across survey tasks. Examples of Local type responses. The distribution of Local responses across the survey tasks.
Distribution of Transitional responses across the survey tasks. Examples of Transitional-shape type responses. Examples of Transitional-center type responses. Examples of Transitional-variation type responses.
Distribution of Initial-Distributional responses across the survey tasks. Examples of Initial-Distributional: proportional type responses. Examples of Initial-Distributional: initial-global type responses. Examples of Distributional type responses.
Distribution of Distributional responses across the survey tasks. Inter-rater reliabilities for coding the survey tasks. Distribution of Cross Task Numeric Lattice Codes. Statistics backgrounds of the participants.
The distribution of responses coded across framework levels from task 1 (the Yellow/Brown task), for all groups. The distribution of responses coded across framework levels from task 2 (the Movie Wait-Time task), for all groups. The distribution of framework level codes, for responses from task 3 (the Pink/Black task), for all groups. Decisions shifts by group for both Pink/Black tasks.
Distribution of responses from the 1-GS group for the Pink/Black task: Without statistics vs. Distribution of Level 2 and Level 3 responses, from the 1-GS group, for the Pink/Black task: Without statistics and With statistics. Distribution of responses from the 1-SE group for the Pink/Black task: Without statistics vs. Distribution of Level 2 and Level 3 responses, from the 1-SE group, for the Pink/Black task: Without statistics and With statistics.
Distribution of responses from the 2-GS group for the Pink/Black task: Without statistics vs. Distribution of Level 2 and Level 3 responses, from the 2-GS group, for the Pink/Black task: Without statistics and With statistics. Distribution of responses from the 2-SE group for the Pink/Black task: Without statistics vs. Distribution of Level 2 and Level 3 responses, from the 2-SE group, for the Pink/Black task: Without statistics and With statistics.
Distribution of responses from the GRAD group for the Pink/Black task: Without statistics vs. Distribution of Level 2 and Level 3 responses, from the GRAD group, for the Pink/Black task: Without statistics and With statistics. The distribution of framework level codes, for responses from task 5 (the Ambulance task), for all groups. Decisions by group for the Ambulance tasks: Counts for Without statistics vs.
Distribution of responses from the 1-GS group for the Ambulance task: Without statistics vs. Distribution of Level 2 and Level 3 responses, from the 1-GS group, for the Ambulance task: Without statistics and With statistics. Distribution of responses from the 1-SE group for the Ambulance task: Without statistics vs. Distribution of Level 2 and Level 3 responses, from the 1-SE group, for the Ambulance task: Without statistics and With statistics.
Distribution of responses from the 2-GS group for the Ambulance task: Without statistics vs. Distribution of Level 2 and Level 3 responses, from the 2-GS group, for the Ambulance task: Without statistics and With statistics. Distribution of responses from the 2-SE group for the Ambulance task: Without statistics vs. Distribution of Level 2 and Level 3 responses, from the 2-SE group, for the Ambulance task: Without statistics and With statistics.
Distribution of responses from the GRAD group for the Ambulance task: Without statistics vs. Distribution of Level 2 and Level 3 responses, from the GRAD group, for the Ambulance task: Without statistics and With statistics. Overall reasoning levels across groups. Cross Task Numeric Codes.
Background information of interviewees. Interviewees’ decisions and response levels for task 1: the Yellow/Brown task. Interviewees’ decisions and response levels for task 2: the Movie Wait-Time task. Interviewees’ decisions, estimates and response levels for tasks 3 and 4: the Pink/Black task (without statistics) and the Pink/Black task with statistics.
Interviewees’ decisions and response levels for tasks 5 and 6: the Ambulance task (without statistics), and the Ambulance task with statistics. Interviewees’ cross task numeric framework levels. The distribution of responses from task 1 (the Yellow/Brown task), coded across framework levels, for group 1-GS. The distribution of responses coded at level 2 (transitional) and level 3 (initial distributional) from survey task 1, for group 1-GS.
The distribution of responses coded across framework levels from task 1 (the Yellow/Brown task), for group 1-SE. The distribution of responses coded at level 2 (transitional) and level 3 (initial distributional) from survey task 1, for group 1-SE. The distribution of responses coded across framework levels from task 1 (the Yellow/Brown task), for group 2-GS. The distribution of responses coded at level 2 (transitional) and level 3 (initial distributional) from survey task 1, for group 2-GS.
The distribution of responses coded across framework levels from task 1 (the Yellow/Brown task), for group 2-SE. The distribution of responses coded at level 2 (transitional) and level 3 (initial distributional) from survey task 1, for group 2-SE. The distribution of responses coded across framework levels from task 1 (the Yellow/Brown task), for group GRAD. The distribution of responses coded at level 2 (transitional) and level 3 (initial distributional) from survey task 1, for group GRAD.
The distribution of responses coded across framework levels from task 2 (the Movie Wait-Time task), for group 1-GS. The distribution of responses coded at level 2 (transitional) and level 3 (initial distributional) from survey task 2, for group 1-GS. The distribution of responses coded across framework levels from task 2 (the Movie Wait-Time task), for group 1-SE. The distribution of responses coded at level 2 (transitional) and level 3 (initial distributional) from survey task 2, for group 1-SE.
The distribution of responses coded across framework levels from task 2 (the Movie Wait-Time task), for group 2-GS. The distribution of responses coded at level 2 (transitional) and level 3 (initial distributional) from survey task 2, for group 2-GS. The distribution of responses coded across framework levels from task 2 (the Movie Wait-Time task), for group 2-SE. The distribution of responses coded at level 2 (transitional) and level 3 (initial distributional) from survey task 2, for group 2-SE.
The distribution of responses coded across framework levels from task 2 (the Movie Wait-Time task), for group GRAD. The distribution of responses coded at level 2 (transitional) and level 3 (initial distributional) from survey task 2, for group GRAD. The distribution of responses coded across framework levels from task 3 (the Pink/Black task), for group 1-GS. The distribution of responses coded at level 2 (transitional) and level 3 (initial distributional) from survey task 3, for group 1-GS.
The distribution of responses coded across framework levels from task 3 (the Pink/Black task), for group 1-SE. The distribution of responses coded at level 2 (transitional) and level 3 (initial distributional) from survey task 3, for group 1-SE. The distribution of responses coded across framework levels from task 3 (the Pink/Black task), for group 2-GS. The distribution of responses coded at level 2 (transitional) and level 3 (initial distributional) from survey task 3, for group 2-GS.
The distribution of responses coded across framework levels from task 3 (the Pink/Black task), for group 2-SE. The distribution of responses coded at level 2 (transitional) and level 3 (initial distributional) from survey task 3, for group 2-SE. The distribution of responses coded across framework levels from task 3 (the Pink/Black task), for group GRAD. The distribution of responses coded at level 2 (transitional) and level 3 (initial distributional) from survey task 3, for group GRAD.
The distribution of responses coded across framework levels from task 5 (the Ambulance task), for group 1-GS. The distribution of responses coded at level 2 (transitional) and level 3 (initial distributional) from survey task 5, for group 1-GS. The distribution of responses coded across framework levels from task 5 (the Ambulance task), for group 1-SE. The distribution of responses coded at level 2 (transitional) and level 3 (initial distributional) from survey task 5, for group 1-SE.
The distribution of responses coded across framework levels from task 5 (the Ambulance task), for group 2-GS. The distribution of responses coded at level 2 (transitional) and level 3 (initial distributional) from survey task 5, for group 2-GS. The distribution of responses coded across framework levels from task 5 (the Ambulance task), for group 2-SE. The distribution of responses coded at level 2 (transitional) and level 3 (initial distributional) from survey task 5, for group 2-SE.
The distribution of responses coded across framework levels from task 5 (the Ambulance task), for group GRAD. The distribution of responses coded at level 2 (transitional) and level 3 (initial distributional) from survey task 5, for group GRAD.424 ix LIST OF FIGURES: Figure Page 1. Two of Gal, Rothschild, and Wagner’s data set comparison tasks. Stem and Leaf Plot of Heights of Students and Basketball Players.
Graphs used in two of the four tasks from Watson and Mortiz’s interview protocol. Item 1: Comparing two samples of measurement data. Item 2: Comparing two samples of measurement data. Hypothetical data generated by students.
Movie Wait-time Task. Meletiou and Lee’s example histograms. Lann and Falk’s data set comparison task. Points Per Game Scored by Two Basketball Players.
Nội dung được bảo vệ bản quyền — Tải xuống đầy đủ
Trích dẫn luận án này
Matthew Alan Ciancetta (2007). Lý luận của sinh viên thống kê khi so sánh dữ liệu [Luận án tiến sĩ, Portland State University]. LuanAn.net. https://luanan.net/giao-duc-hoc/07-ciancetta-dissertation
Câu hỏi thường gặp
Luận án "Lý luận của sinh viên thống kê khi so sánh dữ liệu" nghiên cứu về vấn đề gì?
Luận văn số 07 của Ciancetta: Phân tích chuyên sâu, khám phá các khía cạnh độc đáo. Tìm hiểu ngay để mở rộng kiến thức.
Luận án "Lý luận của sinh viên thống kê khi so sánh dữ liệu" được bảo vệ tại trường nào?
Luận án này được bảo vệ tại Portland State University. Năm bảo vệ: 2007.
Luận án "Lý luận của sinh viên thống kê khi so sánh dữ liệu" thuộc chuyên ngành gì?
Luận án "Lý luận của sinh viên thống kê khi so sánh dữ liệu" thuộc chuyên ngành Mathematics Education. Danh mục: Giáo Dục Học.
Luận án "Lý luận của sinh viên thống kê khi so sánh dữ liệu" có bao nhiêu trang?
Luận án "Lý luận của sinh viên thống kê khi so sánh dữ liệu" có 439 trang. Bạn có thể xem trước một phần tài liệu ngay trên trang web trước khi tải về.
Cách tải luận án "Lý luận của sinh viên thống kê khi so sánh dữ liệu" về máy như thế nào?
Để tải luận án về máy, bạn nhấn nút "Tải xuống ngay" trên trang này, sau đó hoàn tất thanh toán phí lưu trữ. File sẽ được tải xuống ngay sau khi thanh toán thành công. Hỗ trợ qua Zalo: 0559 297 239.