Structural re orientation of magmatic fabrics and layering in the
Tái định hướng cấu trúc của các cấu trúc magma và phân lớp. Nghiên cứu về sự phát triển, biến dạng và tái sắp xếp của các khoáng vật trong đá nóng chảy.
Geology / Biological, Environmental, and Earth Sciences
Luan An
Luận văn thạc sĩ
Năm xuất bản
Số trang
119
Thời gian đọc
18 phút
Lượt xem
0
Lượt tải
0
Phí lưu trữ
40 Point
Tổng quan nhanh
- Chủ đề:
- Structural Re-orientation of Magmatic Fabrics and Layering
- Số trang:
- 119 trang
- Trường:
- The University of Southern Mississippi
- Chuyên ngành:
- Geology / Biological, Environmental, and Earth Sciences
- Tác giả:
- Justin Guillot
- Năm:
- 2021
Tóm tắt nội dung luận án
I.Structural Re orientation of Magmatic Fabrics and Layering
This thesis explores the structural re-orientation of magmatic fabrics and layering within the lower oceanic crust. Data originates from Hole GT1 in the Wadi Tayin massif of the Samail Ophiolite, Oman. The study aims to refine crustal accretion models. Borehole images of layered gabbros provide crucial insights. Core samples from drilling operations inherently lose their original geographic orientation. This loss necessitates a rigorous re-orientation process. The research focuses on restoring the true spatial context of geological features. Accurate re-orientation is vital for understanding tectonic processes. It helps interpret the formation of oceanic crust. The study addresses fundamental questions about the dynamics of magma chambers. It also investigates the subsequent deformation of igneous structures. Understanding these re-orientations allows for a more precise reconstruction of geological events. Such precision is critical for advanced geodynamic models. This work contributes significantly to the field of marine geology and petrology.
1.1. Unveiling Lower Oceanic Crust Formation Secrets
Hole GT1 offers an unparalleled view into the lower oceanic crust. It provides 400 meters of 100% core recovery. This extensive dataset is invaluable for geological research. Two primary models of crustal accretion are tested: the gabbro glacier model and the sheeted sill model. The gabbro glacier model proposes basalt flows from a crystallization site, forming the lower crust. Conversely, the sheeted sill model suggests basaltic melt crystallizes at multiple crustal levels through sills. Resolving the validity of these models enhances understanding of ocean floor development. The insights gained refine our knowledge of how magma flow shapes planetary surfaces. This detailed analysis provides crucial evidence for global tectonic theories. It clarifies the role of structural deformation in crustal evolution.
1.2. Re orienting Core Data from Oman Ophiolite Samples
Core samples retrieved from drilling operations often lose their original geographic orientation. This loss presents a significant challenge for geological interpretation. To overcome this, specialized software like Techlog is employed. Techlog matches core observations with precisely oriented borehole images. These images are oriented relative to north, enabling accurate re-orientation of the physical cores. This re-orientation restores the true strike and dip of magmatic fabrics and igneous layering. Without this process, the preferred orientation of crystals and layers remains unknown. Accurate data is essential for reliable structural deformation analysis. It ensures that observations contribute meaningfully to crustal accretion models. The method provides a robust framework for interpreting geological structures at depth.
II.Advanced Methods for Core Data Re orientation and Analysis
Rigorous methodology underpins the re-orientation and analysis of Hole GT1 core data. The process begins with meticulous core logging, identifying key geological features. Magmatic fabrics and igneous layering are the primary targets for measurement. Following initial core examination, borehole images are correlated with core observations. This step is crucial for establishing a spatial link. Computer programs like Techlog facilitate the precise alignment of data. Data visualization tools, including depth plots and stereonets, are then used. These tools reveal patterns in orientation and distribution. The methodology ensures that all structural deformation features are accurately placed in their original geographic context. This detailed approach allows for robust testing of crustal accretion hypotheses. It provides a foundation for high-confidence geological conclusions. The reliability of the findings hinges on this comprehensive analytical framework. Understanding preferred orientation of minerals and layers requires this level of precision.
2.1. Techlog Software for Geographic Data Alignment
Techlog software plays a pivotal role in the re-orientation workflow. Its primary function involves synchronizing core observations with borehole imaging data. Borehole images are inherently georeferenced, providing a true north orientation. By matching specific features observed in the core (e.g., distinct layers, veins) with corresponding features in the borehole images, the core's original orientation can be reconstructed. This digital alignment process rectifies the structural deformation introduced during drilling. It effectively re-establishes the geographic strike and dip of all measured features. Accurate alignment is paramount for inferring magma flow directions and tectonic stress fields. The software's capabilities ensure a high degree of confidence in the restored orientations. It is an indispensable tool for advanced structural geology studies in drilled cores.
2.2. Comprehensive Data Acquisition from Gabbro Cores
The study involved extensive data acquisition from 400 meters of layered gabbro cores. Measurements focused on identifying and quantifying magmatic fabrics and igneous layering. Observations included recording the strike and dip of these features at various depths. Depth plots were generated to visualize changes in feature frequency and orientation with depth. Histograms provided insights into overall distribution patterns. Stereonets were constructed to analyze the preferred orientation of structural elements. These graphical tools reveal crystal orientation and mineral alignment. Data was also binned by depth intervals to detect localized variations. This multi-faceted data acquisition strategy provides a robust dataset. It allows for detailed structural deformation analysis across the entire sampled section. The data forms the basis for geological model evaluation.
III.Distinct Magmatic Fabrics and Crystal Orientation Insights
Analysis of Hole GT1 cores reveals distinct patterns in magmatic fabrics. These fabrics are crucial indicators of magma flow and crystal orientation during crustal formation. The presence and orientation of these features vary significantly with depth. Magmatic fabrics become more prevalent past 300 meters below surface (mbs). This observation contrasts with the distribution of layering. Most magmatic fabrics exhibit a consistent average strike. This preferred orientation indicates directional forces during their formation. Understanding these patterns offers clues about the thermal and mechanical history of the lower oceanic crust. Variations in fabric intensity and orientation provide evidence for localized structural deformation. These insights are essential for reconstructing magmatic plumbing systems. The data illuminates the complex processes governing mineral alignment in igneous rocks. The study provides a detailed view of crystal organization within the oceanic crust.
3.1. Magmatic Fabric Distribution in Lower Oceanic Crust
Magmatic fabrics show a notable increase in frequency deeper within Hole GT1. These features are less common in the upper 250 mbs but dominate past 300 mbs. This depth-dependent distribution suggests varying conditions during the formation of the lower crust. The increasing presence of magmatic fabrics at greater depths implies more significant magma flow or tectonic stress influence. These fabrics represent the preferred orientation of constituent minerals. Their spatial distribution is key to understanding the solidification processes. This observation provides important constraints for crustal accretion models. It helps distinguish between different mechanisms of crustal growth. The depth variations are indicative of dynamic magmatic processes occurring at different levels.
3.2. Orientation Shifts in Preferred Crystal Alignment
The study identified a consistent average strike of approximately 060 degrees for most magmatic fabrics. This preferred orientation suggests a dominant direction of magma flow or tectonic stress during crystallization. However, a significant orientation shift occurs past 300 mbs. Both magmatic fabrics and igneous layering transition from a northeast to a southwest strike. This shift indicates a change in the local structural deformation regime or magma flow pathways. The change in crystal orientation at depth is a critical finding. It challenges models assuming uniform conditions. This variability supports the idea of dynamic and localized processes. Such shifts are important for understanding the evolution of mineral alignment in the oceanic crust. They highlight the complexity of deep crustal processes.
IV.Igneous Layering Patterns and Tectonic Stress Indicators
Igneous layering within the Hole GT1 cores provides further insights into crustal formation and structural deformation. Layering is a common feature throughout the borehole, particularly in the shallower sections. It represents variations in mineralogy, grain size, or crystal orientation often indicative of magma flow or settling processes. Past 250 meters below surface (mbs), igneous layering becomes notably sparse. This contrasts with the increasing frequency of magmatic fabrics at greater depths. The distribution and orientation of igneous layering are critical for distinguishing between crustal accretion models. Analyzing these patterns helps determine the influence of tectonic stress versus purely magmatic processes. The study meticulously documents these flow banding and cumulate layering features. Their characteristics offer a window into the dynamic environment of the lower oceanic crust. Understanding layering provides crucial context for magmatic history.
4.1. Spatial Distribution of Igneous Layering Downhole
Igneous layering is more prevalent in the upper parts of Hole GT1. It is frequently observed but becomes sparse beyond 250 mbs. This distribution suggests a change in the mechanisms responsible for layer formation at different depths. The presence of flow banding and cumulate layering in the shallower sections indicates processes like gravitational settling or sequential magma flow events. The decrease in layering at deeper levels may signify a transition to conditions favoring magmatic fabric development. This spatial variation provides important clues about the evolving architecture of the lower oceanic crust. It helps reconstruct the sequence of melt intrusion and solidification. The patterns contribute to a more nuanced understanding of crustal growth processes. This data offers critical input for geological models.
4.2. Strike Orientations and Structural Deformation Clues
Measurements indicate igneous layering primarily strikes close to 355 degrees. This distinct preferred orientation contrasts with the strike of magmatic fabrics. Similar to fabrics, layering also experiences an orientation shift from northeast to southwest past 300 mbs. This synchronous shift suggests a common underlying cause for structural deformation. Possible factors include tectonic stress acting on the solidifying crust or changes in the overall magma flow regime. The consistency in orientation changes across both feature types reinforces their interconnected evolution. These strike patterns are vital for interpreting the paleostress field. They also inform about the kinematics of crustal extension and accretion. The combined evidence helps unravel the complex geological history.
V.Refining Crustal Accretion Models Sheeted Sills Insight
The findings from Hole GT1 significantly refine existing crustal accretion models. The observed non-systematic distribution of magmatic fabrics and igneous layering provides strong evidence supporting the sheeted sill model. This model posits that basaltic melt crystallizes at multiple levels within the crust through successive sill intrusions. It directly challenges the gabbro glacier model, which predicts a more uniform, downward flow and crystallization. The data suggests a more dynamic and less continuous process. This indicates that crustal growth is not a simple conveyor-belt mechanism. Instead, it involves intricate magma flow pathways and episodic melt intrusion. The implications for understanding oceanic crust formation are profound. It emphasizes a complex, multi-stage process driven by localized magmatic activity rather than large-scale unidirectional flow. This provides a detailed perspective on how cumulate layering and flow banding develop.
5.1. Evidence for Sheeted Sill Model Over Gabbro Glacier
The study's observations of magmatic fabrics and igneous layering strongly support the sheeted sill model. The non-systematic distribution of these features, particularly the depth-dependent variations and orientation shifts, aligns well with melt intruding at multiple levels. This contrasts sharply with the gabbro glacier model, which would likely produce more coherent and systematic fabric and layering orientations. The sheeted sill model accommodates the observed variability more effectively. It suggests that individual sill intrusions create localized preferred orientation of crystals and layers. This evidence indicates a complex interplay of magma flow and crystallization events. It offers a more dynamic explanation for the structure of the lower oceanic crust. The data provides compelling support for this model over its alternative.
5.2. Melt Intrusion and Localized Crustal Development
The variance in dip azimuth observed downhole implies that magmatic fabrics and igneous layering formed through local processes. This supports the concept of melt intruding an upper crystal mush reservoir. This reservoir functions as a 'mixing bowl,' where new melt interacts with existing crystals. Sufficient melt presence allows for further intrusion, leading to the development of localized layering and preferred orientation of crystals. This 'mixing bowl' scenario explains the observed heterogeneity in mineral alignment and layer strike. It underscores the importance of localized magma flow and melt intrusion events. These findings align with geochemical evidence suggesting the lower crust forms in an open system. Multiple re-intrusions contribute to the complex structural deformation observed.
VI.Local Processes and Open System Lower Crust Formation
The comprehensive analysis of Hole GT1 data emphasizes the role of local processes in the formation of the lower oceanic crust. The observed variability in magmatic fabrics and igneous layering orientations, coupled with their non-systematic distribution, points to dynamic and localized geological events. This contrasts with models positing uniform, large-scale magma flow. The findings align with geochemical evidence suggesting the lower crust develops within an open magmatic system. Multiple melt intrusion events reshape and reorient existing structures. This dynamic environment is far from a simple, continuous accretion process. It involves repeated episodes of tectonic stress and structural deformation. The study paints a picture of a constantly evolving crustal architecture. It highlights the importance of localized conditions over broad, uniform mechanisms. This work provides critical data for future geodynamic simulations.
6.1. Variable Dip Azimuth and Localized Formation
The significant variance in dip azimuth observed throughout the Hole GT1 cores strongly indicates localized formation processes. This variability applies to both magmatic fabrics and igneous layering. If a uniform, large-scale magma flow or tectonic stress regime dominated, features would exhibit more consistent orientations. Instead, the diverse dip azimuths suggest that conditions varied significantly over short distances and timeframes. This supports the idea that small-scale melt intrusion events or localized structural deformation play a crucial role. These local influences lead to heterogeneous mineral alignment and crystal orientation. The data challenges monolithic models of crustal growth. It underscores the complexity inherent in deep crustal environments. Understanding this variability is key to accurate geological interpretations.
6.2. Lower Crust Formation in an Open Magmatic System
This research provides robust evidence that the lower crust forms in an open magmatic system. Geochemical data independently supports this conclusion. The observed patterns of magmatic fabrics and igneous layering, along with their orientation shifts, are consistent with multiple re-intrusions. These re-intrusions involve new batches of melt interacting with previously solidified or partially molten crustal material. This dynamic 'mixing bowl' environment leads to the development of diverse structural deformation features. It allows for preferred orientation of crystals under varying magma flow conditions. The open system model represents a more accurate depiction of crustal evolution. It emphasizes continuous modification and reshaping of the lower oceanic crust. This perspective offers a comprehensive framework for future geological studies.
Mục lục chi tiết luận án
Tải xuống file đầy đủ để xem toàn bộ nội dung
Tải đầy đủ (119 trang)Trích đoạn nội dung luận án
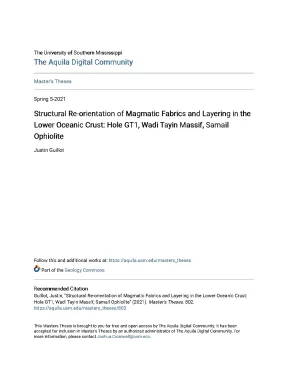
Tải xuống để đọc toàn bộThe University of Southern Mississippi The Aquila Digital Community Master's Theses Spring 5-2021 Structural Re-orientation of Magmatic Fabrics and Layering in the Lower Oceanic Crust: Hole GT1, Wadi Tayin Massif, Samail Ophiolite Justin Guillot Follow this and additional works at: https://aquila.edu/masters_theses Part of the Geology Commons Recommended Citation Guillot, Justin, "Structural Re-orientation of Magmatic Fabrics and Layering in the Lower Oceanic Crust: Hole GT1, Wadi Tayin Massif, Samail Ophiolite" (2021).edu/masters_theses/802 This Masters Thesis is brought to you for free and open access by The Aquila Digital Community. It has been accepted for inclusion in Master's Theses by an authorized administrator of The Aquila Digital Community. For more information, please contact Joshua. STRUCTURAL RE-ORIENTATION OF MAGMATIC FABRICS AND LAYERING IN THE LOWER OCEANIC CRUST: HOLE GT1, WADI TAYIN MASSIF, SAMAIL OPHIOLITE by Justin Guillot A Thesis Submitted to the Graduate School, the College of Arts and Sciences and the School of Biological, Environmental, and Earth Sciences at The University of Southern Mississippi in Partial Fulfillment of the Requirements for the Degree of Master of Science Approved by: Dr.
Jeremy Deans, Committee Chair Dr. Mark Puckett Dr. Franklin Heitmuller May 2021 COPYRIGHT BY Justin Guillot 2021 Published by the Graduate School ABSTRACT This thesis aims to re-orient borehole images of layered gabbros sampled beneath Hole GT1 in the Wadi Tayin massif of the Oman ophiolite by the Oman Drilling Project to better constrain models of crustal accretion. The gabbro glacier model proposes that crystallized basalt flows down and away from the crystallization site to form the lower crust while the sheeted sill model proposes that basaltic melt crystallizes at multiple levels in the crust through sills.
Hole GT1 provides an unprecedented 400 m, 100% recovery, look at the lower oceanic crust. Cores lose their geographic orientation when drilled, requiring use of the programs like Techlog to match core observations with borehole images oriented relative to north to re-orient the core. Layering is more common throughout the borehole overall but becomes sparse past 250 meters below surface (mbs) whereas magmatic fabrics become more frequent past 300 mbs. Most magmatic fabrics share an average strike of 060 while layering measurements strike close to 355.
Both undergo an orientation shift from NE to SW past 300 mbs. The non-systematic distribution of MFs and layering observed below Hole GT1 matches more closely with the sheeted sill model and the idea of melt intruding an upper crystal mush reservoir as a mixing bowl that develops layering and fabrics if enough melt is present for further intrusion. The variance in dip azimuth downhole implies that these features formed through local processes, which supports geochemical evidence that the lower crust forms in an open system through multiple re-intrusions. ii ACKNOWLEDGMENTS I hereby express my deepest gratitude to my Committee Chair Dr.
Jeremy Deans for their support, advice, and patience throughout the past few years. It is through the help of their written comments, experience, and sincere words of encouragement that I was able to complete this thesis. I would also like to thank Dr. Franklin Heitmuller and Dr.
Mark Puckett for taking the time to be members of my committee in addition to being great teachers who have contributed to my overall growth as a geologist. iii TABLE OF CONTENTS ABSTRACT. iii LIST OF TABLES. vii LIST OF ILLUSTRATIONS.
viii LIST OF ABBREVIATIONS. xiv CHAPTER I - INTRODUCTION. 7 CHAPTER II –METHODS .1 Materials and Methods. 10 CHAPTER III – RESULTS .1 Depth Plots and Histograms.2 Dip Azimuth vs.
Depth Plot: Layering .3 Dip Azimuth vs. Depth Plot: All Data .4 Dip Azimuth Vs. Depth Plot: High Confidence .1 Stereonet: Magmatic Fabrics .3 Stereonet: All Data .4 Stereonet: High Confidence .3 Depth Bin Stereonets .2 Depth Bins: Magmatic Fabrics .1 MF Depth Bin: 30-100 Mbs (30 Measurements) .2 MF Depth Bin: 100-150 Mbs (37 Measurements) .3 MF Depth Bin: 150-200 Mbs (29 Measurements) .4 MF Depth Bin: 200-250 Mbs (29 Measurements) .5 MF Depth Bin 250-300 Mbs (11 Measurements) .6 MF Depth Bin: 300-350 Mbs (14 Measurements) .7 MF Depth Bin: 350-403 Mbs (33 Measurements) .3 Depth Bins: Layering .1 Layering Depth Bin: 30-100 Mbs (38 Measurements) .2 Layering Depth Bin: 100-150 Mbs (55 Measurements) .3 Layering Depth Bin: 150-200 Mbs (47 Measurements) .4 Layering Depth Bin: 200-250 Mbs (20 Measurements) .5 Layering Depth Bin: 250-300 Mbs (17 Measurements) .6 Layering Depth Bin: 300-350 Mbs (19 Measurements) .7 Layering Depth Bin: 350-403 Mbs (16 Measurements) .4 Depth Bins: All Data .1 All Data Depth Bin: 30-100 Mbs (68 Measurements) .2 All Data Depth Bin: 100-150 Mbs (92 Measurements) .3 All Data Depth Bin: 150-200 Mbs (76 Measurements) .4 All Data Depth Bin: 200-250 Mbs (49 Measurements) .5 All Data Depth Bin: 250-300 Mbs (28 Measurements) .6 All Data Depth Bin: 300-350 Mbs (33 Measurements) .7 All Data Depth Bin: 350-403 Mbs (49 Measurements). 81 CHAPTER IV – DISCUSSION.1 Magmatic Fabric vs.2 Orientation Variations with Depth .3 Formation of Magmatic Fabrics and Layering .4 Comparisons to Models of Crustal Accretion .5 Potential for an Alternative Model.
95 vi LIST OF TABLES Table 3.1 Summary of strikes found for each feature type within the respective depth bin. 40 vii LIST OF ILLUSTRATIONS Figure 1. Illustration of models for crustal accretion at fast spreading mid-ocean ridges.2 Geological and structural map from the Wadi Tayin massif of the Oman Ophiolite .1 Example comparison between a shipboard core image (unrolled whole core; left) and borehole image in Techlog (right).1 Reoriented Dip Azimuth vs. depth plot for all magmatic fabrics observed in this study.2 Histogram depicting frequency and cumulative percentages for all magmatic fabrics identified in this study.3 Reoriented Dip Azimuth vs.
Depth Plot for all layering structures observed in this study.4 Histogram displaying frequency and cumulative percentages of all instances of layering observed in Hole GT1.5 Reoriented Dip Azimuth vs. Depth plot for all structures observed in this study.6 Histogram displaying frequency and cumulative percentage for all data points observed in this study.7 Reoriented dip azimuth vs. depth plot for all measurements that have a confidence value of 4 or 5.8 Histogram displaying frequency and cumulative percentage for data points observed in this study that have a confidence value of 4 or 5.9 Stereonet of magmatic fabrics displayed as planes alongside a Rose Diagram in the center.10 Stereonet of magmatic fabric poles displayed alongside 1% area contouring with the contour interval spacing value set to 3%.11 Stereonet with respective poles of layering plotted.12 Stereonet displaying poles to layering with 1% area contouring with contour spacing intervals of 3%.13 Stereonet containing all data plotted as planes along with Rose diagram.14 Stereonet of all data displayed as poles and 1% area contouring with contour spacing intervals of 3%.15 Stereonet plot of all high confidence values plotted as planes and a Rose diagram.16 Stereonet plot of high confidence poles with 1% area contours in intervals of 3%.17 Comparison between depth bin stereonets for magmatic fabrics and layering from 30mbs to 150mbs.18 Comparison between depth bin stereonets for magmatic fabrics and layering from 150mbs to 300mbs.19 Comparison between depth bin stereonets for magmatic fabrics and layering from 300mbs to 403mbs.20 Stereonet plot of dip strike for all MF measurements in the 30-100 mbs depth bin.21 Stereonet plot for all MF measurements in the 30-100 mbs depth bin as poles with 1% area contours in intervals of 3%.22 Stereonet plot of dip and strike for all MF measurements in the 100-150 mbs depth bin.23 Stereonet plot for all MF measurements in the 100-150 mbs depth bin as poles with 1% area contours in intervals of 3%.24 Stereonet plot of dip and strike for all MF measurements in the 150-200 mbs depth bin.25 Stereonet plot of all MF measurements in the 150-200 mbs depth bin as poles with 1% area contours in intervals of 3%.26 Stereonet plot of dip and strike for all MF measurements in the 200-250 mbs depth bin.27 Stereonet plot for all MF measurements in the 200-250 mbs depth bin as poles with 1% area contours in intervals of 3%.28 Stereonet plot of dip and strike for all MF measurements in the 250-300 mbs depth bin.29 Stereonet plot for all MF measurements in the 250-300 mbs depth bin as poles with 1% area contours in intervals of 3%.30 Stereonet plot of dip and strike for all MF measurements in the 300-350 mbs depth bin.31 Stereonet plot for all MF measurements in the 300-350 mbs depth bin as poles with 1% area contours in intervals of 3%.32 Stereonet plot of dip and strike for all MF measurements in the 350-403 mbs depth bin.33 Stereonet plot for all MF measurements in the 350-403 mbs depth bin as poles with 1% area contours in intervals of 3%.34 Stereonet plot of dip and strike for all layering measurements in the 30-100 mbs depth bin.35 Stereonet plot for all layering measurements in the 30-100 mbs depth bin as poles with 1% area contours in intervals of 3%.36 Stereonet plot of dip and strike for all layering measurements in the 100-150 mbs depth bin.37 Stereonet plot for all layering measurements in the 100-150 mbs depth bin as poles with 1% area contours in intervals of 3%.38 Stereonet plot of all layering measurements in the 150-200 mbs depth bin as poles with 1% area contours in intervals of 3%.39 Stereonet plot of all layering measurements in the 150-200 mbs depth bin as poles with 1% area contours in intervals of 3%.40 Stereonet plot of dip and strike for all layering measurements in the 200-250 mbs depth bin.41 Stereonet plot for all layering measurements in the 200-250 mbs depth bin as poles with 1% area contours in intervals of 3%.42 Stereonet plot of dip and strike for all layering measurements in the 250-300 mbs depth bin.43 Stereonet plot for all layering measurements in the 250-300 mbs depth bin as poles with 1% area contours in intervals of 3%.44 Stereonet plot of dip and strike for all layering measurements in the 300-350 mbs depth bin.45 Stereonet plot for all layering measurements in the 300-350 mbs depth bin as poles with 1% area contours in intervals of 3%.46 Stereonet plot of dip and strike for all layering measurements in the 350-403 mbs depth bin.47 Stereonet plot for all layering measurements in the 350-403 mbs depth bin as poles with 1% area contours in intervals of 3%.48 Stereonet plot of dip and strike for the 30-100 mbs depth bin.49 Stereonet plot of the 30-100 mbs depth bin as poles with 1% area contours in intervals of 3%.50 Stereonet plot of dip and strike for the 100-150 mbs depth bin.51 Stereonet plot of the 100-150 mbs depth bin as poles with 1% area contours in intervals of 3%.52 Stereonet plot of dip and strike for the 150-200 mbs depth bin.53 Stereonet plot of the 150-200 mbs depth bin as poles with 1% area contours in intervals of 3%.54 Stereonet plot of dip and strike for the 200-250 mbs depth bin.55 Stereonet plot of the 200-250 mbs depth bin as poles with 1% area contours in intervals of 3%.56 Stereonet plot of dip and strike for the 250-300 mbs depth bin.57 Stereonet plot of the 250-300 mbs depth bin as poles with 1% area contours in intervals of 3%.58 Stereonet plot of dip and strike for the 300-350 mbs depth bin.59 Stereonet plot of the 300-350 mbs depth bin as poles with 1% area contours in intervals of 3%.60 Stereonet plot of dip and strike for the 350-403 mbs depth bin.61 Stereonet plot of the 350-403 mbs depth bin as poles with 1% area contours in intervals of 3%.1 Side by side comparison of stereonets and respective Rose diagrams for magmatic fabrics, layering, and all data. 88 xiii LIST OF ABBREVIATIONS CRF Coordinate Reference Frame Mbs Meters below surface SPO Shape-Preferred Orientation xiv CHAPTER I - INTRODUCTION 1.
Nội dung được bảo vệ bản quyền — Tải xuống đầy đủ
Trích dẫn luận án này
Justin Guillot (2021). Structural re orientation of magmatic fabrics and layering i [Luận án tiến sĩ, The University of Southern Mississippi]. LuanAn.net. https://luanan.net/khoa-hoc-trai-dat-moi-truong/dia-chat/structural-re-orientation-of-magmatic-fabrics-and-layering-in-the
Câu hỏi thường gặp
Luận án "Structural re orientation of magmatic fabrics and layering i" nghiên cứu về vấn đề gì?
Tái định hướng cấu trúc của các cấu trúc magma và phân lớp. Nghiên cứu về sự phát triển, biến dạng và tái sắp xếp của các khoáng vật trong đá nóng chảy.
Luận án "Structural re orientation of magmatic fabrics and layering i" được bảo vệ tại trường nào?
Luận án này được bảo vệ tại The University of Southern Mississippi. Năm bảo vệ: 2021.
Luận án "Structural re orientation of magmatic fabrics and layering i" thuộc chuyên ngành gì?
Luận án "Structural re orientation of magmatic fabrics and layering i" thuộc chuyên ngành Geology / Biological, Environmental, and Earth Sciences. Danh mục: Địa Chất.
Luận án "Structural re orientation of magmatic fabrics and layering i" có bao nhiêu trang?
Luận án "Structural re orientation of magmatic fabrics and layering i" có 119 trang. Bạn có thể xem trước một phần tài liệu ngay trên trang web trước khi tải về.
Cách tải luận án "Structural re orientation of magmatic fabrics and layering i" về máy như thế nào?
Để tải luận án về máy, bạn nhấn nút "Tải xuống ngay" trên trang này, sau đó hoàn tất thanh toán phí lưu trữ. File sẽ được tải xuống ngay sau khi thanh toán thành công. Hỗ trợ qua Zalo: 0559 297 239.