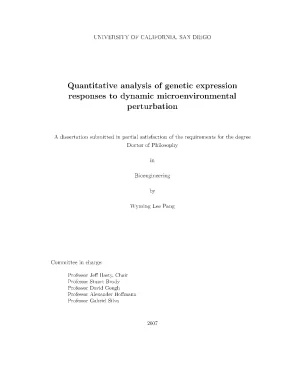
Luận án tiến sĩ: Quantitative analysis of genetic expression responses to dynamic microenvironmental perturbation
Nghiên cứu tiến sĩ phân tích định lượng biểu hiện gen khi phản ứng với biến động môi trường vi mô. Làm sáng tỏ cơ chế điều hòa sinh học quan trọng.
Bioengineering
Luan An
Luận án tiến sĩ
Năm xuất bản
Số trang
357
Thời gian đọc
54 phút
Lượt xem
0
Lượt tải
0
Phí lưu trữ
60 Point
Tổng quan nhanh
- Chủ đề:
- Quantitative Analysis of Genetic Expression Responses
- Số trang:
- 357 trang
- Trường:
- University of California, San Diego
- Chuyên ngành:
- Bioengineering
- Tác giả:
- Wyming Lee Pang
- Năm:
- 2007
Tóm tắt nội dung luận án
I.Quantitative Analysis of Genetic Expression Responses
The study focuses on the quantitative analysis of genetic expression in response to dynamic microenvironmental perturbation. Understanding how living cells adapt to changing surroundings is critical in biology and medicine. This research investigates the intricate mechanisms driving cellular responses to external fluctuations. Traditional methods often provide only static snapshots, failing to capture the full complexity of dynamic interactions. This dissertation addresses that gap. It highlights the necessity for new approaches to monitor gene expression in real-time under precisely controlled, varying conditions. The work explores the profound impact of a dynamic environment on internal cellular machinery. It establishes a foundation for decoding adaptive strategies at the molecular level, moving beyond qualitative observations to robust, data-driven insights. The ultimate goal is to unravel the sophisticated network of gene regulation that underpins cellular resilience and survival.
1.1. Understanding Dynamic Environments and Cellular Responses
Living cells constantly face fluctuating conditions. They must adapt their internal states to survive. Microenvironmental perturbation can include changes in nutrient availability, pH, temperature, or the presence of signaling molecules. These dynamics trigger specific cellular responses. At the core of these responses is gene expression. Cells alter their protein production profile to match the new demands. This dissertation provides a framework for observing and quantifying these intricate adjustments. It details how the research systematically imposes controlled changes. The subsequent genetic expression patterns are then measured. The aim is to map the cause-and-effect relationships between external dynamics and internal biological processes. This understanding is vital for fields ranging from developmental biology to disease progression, where cellular adaptability plays a pivotal role.
1.2. Challenges in Monitoring Gene Expression
Monitoring gene expression in dynamic environments presents significant challenges. Conventional techniques often lack the temporal resolution needed to capture rapid cellular changes. They may also struggle with providing quantitative analysis across large cell populations over extended periods. Achieving precise control over the cellular microenvironmental perturbation is another hurdle. Replicating the complexity of in vivo conditions within a controlled experimental setup requires innovative engineering. Furthermore, the sheer volume of data generated by dynamic studies demands advanced bioinformatics and computational tools. This research directly confronts these limitations. It develops novel methodologies and platforms. These advancements enable accurate, real-time measurements of transcriptomics data. The focus is on overcoming technical barriers to yield unprecedented insights into dynamic gene regulation. The new tools facilitate a deeper, more comprehensive understanding of cellular adaptability.
II.Advanced Platform for Dynamic Microenvironmental Control
This research developed an advanced platform specifically designed for imposing and analyzing dynamic microenvironmental perturbation. The platform represents a significant leap in experimental capability. It allows for unprecedented control over the cellular surroundings. This precise control is crucial for inducing specific, reproducible changes. The system integrates innovative microfluidic technology. This technology enables the creation of highly controlled dynamic environments for living cells. The platform overcomes limitations of traditional batch culture methods, offering continuous, real-time observation. It facilitates the quantitative analysis of genetic expression under precisely modulated conditions. The entire system is engineered for long-duration experiments, capturing transient and sustained cellular responses. This holistic approach provides a robust framework for investigating complex biological phenomena. It pushes the boundaries of experimental biology, revealing new facets of gene regulation.
2.1. Novel Microfluidic Device Development
A cornerstone of this research is the development of novel microfluidic devices. These devices are meticulously engineered to create highly precise and controllable dynamic environments. The microfluidic chips allow for the rapid and accurate delivery of various chemical cues. They facilitate the creation of steep or gradual microenvironmental perturbation. Examples include the Tesla micro-Chemostat (TC) and Temporal Tesla micro-Chemostat (T2uC). These designs ensure uniform and reproducible conditions across cell populations. The devices minimize shear stress and maintain cell viability over extended experimental durations. Their compact nature allows for parallel experimentation, increasing throughput. This innovation in microfluidics is essential for generating reliable data on gene expression dynamics. It is a key enabler for performing sophisticated quantitative analysis of cellular adaptation. The designs offer versatility for a wide range of biological applications.
2.2. High Throughput Imaging and Data Processing
The platform integrates high-throughput imaging capabilities with advanced data processing. An automated microscopy system captures detailed images of cells within the microfluidic devices. This system performs long-duration time-lapse imaging, crucial for observing dynamic genetic expression. The reduction of thermally induced drift in the focal plane ensures image stability and quality. Subsequent image processing and analysis are performed using specialized software (e.g., IAISQT). This software segments individual cells, quantifies fluorescent signals (representing gene expression), and tracks cell trajectories. These tools transform raw image data into rich, quantitative analysis datasets. The robust methodologies ensure accuracy and reproducibility of the measurements. This integrated approach is vital for extracting meaningful biological insights from the complex dynamic responses. It provides a reliable pipeline for transcriptomics data acquisition and interpretation, critical for understanding cellular responses.
2.3. Controllable Dynamic Microenvironments
The platform achieves controllable dynamic microenvironments through sophisticated fluidic management. Driving and controlling fluid flow within the microfluidic devices is highly precise. This allows for the generation of specific, predefined microenvironmental perturbation waveforms. Nutrient concentrations, pH levels, or drug exposure can be rapidly switched or gradually ramped. This capability is essential for simulating physiological fluctuations and stress responses. The system ensures that cells experience reproducible and well-defined dynamic environments. This level of control is paramount for conducting rigorous quantitative analysis of gene expression. It enables researchers to isolate the effects of specific perturbations on cellular responses. The experimental setup is designed for consistency, ensuring that observed variations in genetic expression are directly attributable to the controlled environmental changes, leading to robust conclusions about gene regulation.
III.Metabolic Gene Regulation in Dynamic Cellular Environments
This section details the investigation into metabolic gene regulation within dynamic cellular environments. The research applies the developed platform to study specific biological systems. It focuses on how cells adjust their metabolic pathways in response to continuous environmental shifts. Understanding these adaptive mechanisms is crucial for comprehending cellular resilience and survival. The study provides concrete examples of genetic expression changes in key metabolic genes. It demonstrates how microenvironmental perturbation directly impacts the cellular machinery responsible for energy production and nutrient utilization. The quantitative analysis reveals specific patterns of gene expression triggered by varying external cues. These findings contribute significantly to the understanding of how cells maintain homeostasis and function under stress. The work illuminates the intricate connection between environmental dynamics and metabolic reprogramming, essential for cellular responses.
3.1. Investigating Metabolic Pathway Responses
The dissertation specifically investigates metabolic pathway responses to dynamic microenvironmental perturbation. A key focus is on the galactose utilization pathway, a well-characterized system. The study monitors the gene expression of components within this pathway. Cells are subjected to fluctuating galactose availability. This allows for direct observation of how metabolic genes are regulated in a dynamic environment. The quantitative analysis of reporter gene expression provides insights into pathway activation and repression kinetics. This helps to understand the speed and magnitude of cellular responses. The research identifies specific regulatory elements and their contribution to adaptive behavior. These detailed observations offer a mechanistic understanding of how metabolic systems cope with variability. The findings have implications for understanding metabolic diseases and developing engineered biological systems, expanding knowledge in genomics and transcriptomics.
3.2. Materials and Methods for Gene Expression Studies
Rigorous materials and methods underpin the gene expression studies. Microfluidic device fabrication follows precise protocols to ensure device reproducibility. Cell preparation and culture conditions are standardized for consistency. The choice of parent and fluorescent variant strains facilitates real-time monitoring of genetic expression. Steady-state expression characterization provides a baseline for dynamic experiments. The methodology includes detailed steps for confining microbial biofilms and microcolonies within the devices. This ensures consistent cell density and observation geometry. Advanced techniques are used for measuring reporter protein fluorescence, offering a direct readout of gene regulation. The entire experimental setup is designed to minimize external noise and maximize the accuracy of quantitative analysis. This meticulous approach ensures the reliability and validity of the observed cellular responses to microenvironmental perturbation.
IV.Computational Experimental Analysis of Gene Robustness
This section integrates computational and experimental analysis to assess gene robustness. The research explores how gene expression systems maintain stable function despite dynamic microenvironmental perturbation. Robustness is a critical property of biological systems, enabling survival in variable conditions. This dissertation uses a combined approach to quantify this resilience. Computational models are developed to simulate gene regulation networks under fluctuating inputs. These models are then validated against experimental data collected from the microfluidic platform. The quantitative analysis identifies mechanisms that confer stability to cellular responses. It investigates how transcriptional and translational processes contribute to system robustness. This interdisciplinary approach provides a comprehensive understanding of adaptive strategies, bridging theoretical predictions with empirical observations. The insights are vital for predicting cellular behavior in complex, real-world scenarios, leveraging bioinformatics for deeper understanding of genomics.
4.1. Robustness of Genetic Responses to Perturbation
The study specifically examines the robustness of genetic responses to environmental changes. Cells need to exhibit stable gene expression patterns, even with noisy or fluctuating inputs. This research quantifies how well cells buffer the effects of microenvironmental perturbation. It investigates whether specific gene regulation strategies contribute to this resilience. For example, the study assesses how feedback loops or redundant pathways enhance robustness. The quantitative analysis provides metrics for comparing the stability of different genetic circuits. This understanding is crucial for engineering more resilient synthetic biological systems. It also sheds light on evolutionary advantages of robust cellular responses. The findings demonstrate that dynamic environments often select for systems capable of maintaining essential functions despite external variability, a key aspect of genomics and transcriptomics.
4.2. Integrative Data Analysis and Modeling
Integrative data analysis and modeling are central to understanding gene robustness. Experimental data from the microfluidic platform are combined with computational simulations. Mathematical models of gene regulation are constructed. These models incorporate known biological interactions and parameters derived from experiments. The bioinformatics approach allows for the prediction of genetic expression dynamics under various dynamic environment scenarios. Discrepancies between model predictions and experimental observations guide further hypothesis testing. This iterative process refines the understanding of underlying biological mechanisms. The computational analysis helps to identify key control points and feedback mechanisms within complex networks. It provides a powerful tool for interpreting large datasets generated from quantitative analysis of cellular responses. This synthesis of theory and experiment offers a holistic view of dynamic gene expression.
V.Summarizing Insights and Future Research Directions
This section summarizes the key contributions and outlines future research directions. The dissertation presents significant advancements in the quantitative analysis of genetic expression under dynamic microenvironmental perturbation. It introduces a novel experimental platform and robust methodologies. These tools enable unprecedented insights into cellular responses and gene regulation. The research demonstrates how cells precisely adjust their gene expression profiles to adapt to fluctuating conditions. Key findings highlight the importance of understanding dynamics, not just static states. The work provides a strong foundation for future investigations into complex biological systems. It underscores the critical role of engineering in advancing fundamental biological understanding. The implications extend to fields requiring precise control over cellular behavior, from medical diagnostics to bio-production, impacting transcriptomics and genomics.
5.1. Key Discoveries in Genetic Expression Dynamics
Several key discoveries in genetic expression dynamics emerged from this research. The study successfully quantified gene expression changes in real-time within controlled dynamic environments. It revealed specific patterns of metabolic gene regulation in response to varying nutrient levels. The importance of robustness in cellular responses to microenvironmental perturbation was clearly demonstrated. The developed microfluidic platform proved effective for long-duration, high-resolution monitoring. Methodologies for image processing and quantitative analysis were validated, providing reliable data. The research also highlighted the power of integrating experimental data with computational modeling for understanding complex biological systems. These discoveries collectively advance the understanding of how cells sense, process, and respond to their ever-changing surroundings, contributing to the growing body of knowledge in genomics and bioinformatics.
5.2. Expanding the Scope of Microenvironmental Perturbation
Future research will involve expanding the scope of microenvironmental perturbation. The current platform can be adapted to explore a wider range of dynamic cues, beyond nutrient changes. This includes investigating responses to fluctuating pH, oxygen levels, mechanical stress, or combinations thereof. Applying these methods to different cell types, such as mammalian cells or multicellular systems, is another promising avenue. Further refinement of bioinformatics tools could enable even deeper quantitative analysis of transcriptomics and genomics data. Integrating multi-omics data, such as proteomics and metabolomics, would provide a more holistic view of cellular responses. The goal is to build increasingly sophisticated models of gene regulation that can predict cellular behavior in complex, heterogeneous environments. This ongoing work will continue to push the boundaries of understanding living systems in their natural, dynamic contexts.
Mục lục chi tiết luận án
Tải xuống file đầy đủ để xem toàn bộ nội dung
Tải đầy đủ (357 trang)Nội dung chính
Tổng quan về luận án
Luận án "Quantitative analysis of genetic expression responses to dynamic microenvironmental perturbation" của Wyming Lee Pang, được bảo vệ tại Đại học California, San Diego vào năm 2007, đại diện cho một bước đột phá trong lĩnh vực sinh học định lượng. Nghiên cứu này tập trung vào việc vượt qua những hạn chế cố hữu của các phương pháp phân tích biểu hiện gen truyền thống vốn thường chỉ dựa vào các kích thích đơn giản, tĩnh tại, hoặc xung, vốn không thể mô phỏng chính xác sự phức tạp của môi trường sinh học tự nhiên. Luận án đặt ra mục tiêu xây dựng một nền tảng thực nghiệm tiên tiến, đặc biệt là công nghệ vi lỏng (microfluidic technology), để thăm dò và định lượng phản ứng của mạng lưới điều hòa gen trong điều kiện môi trường động, từ đó khám phá những cơ chế thông tin mới ở cấp độ tế bào đơn.
Research Gap SPECIFIC với citations từ literature: Mặc dù môi trường tự nhiên liên tục biến động với các yếu tố như nguồn dinh dưỡng, chu kỳ bức xạ, và áp lực cơ học, các nghiên cứu về biểu hiện và điều hòa gen trong phòng thí nghiệm lại "hiếm khi tận dụng các nhiễu động có tính động cao" (tr. xviii). Các kỹ thuật hiện có như tế bào dòng chảy (flow cytometry) hay vi mảng gen (gene microarrays) chỉ cung cấp "những bức ảnh tức thời về trạng thái biểu hiện tế bào" (tr. 5), thiếu đi độ phân giải thời gian cần thiết để nắm bắt các đặc tính động phức tạp. Các nghiên cứu trước đây về mạng lưới điều hòa gen "chủ yếu dựa vào các phương tiện nhiễu động hệ thống tương đối đơn giản, chẳng hạn như đầu vào một bước hoặc xung trong một chuỗi thời gian[15, 90]" (tr. 4). Hạn chế này đã tạo ra một khoảng trống đáng kể trong việc hiểu cách các hệ thống sinh học thực sự xử lý và phản ứng với các tín hiệu môi trường biến đổi liên tục, và đặc biệt là thiếu "công nghệ cho phép các nghiên cứu như vậy" (tr. xviii). Luận án này đã lấp đầy khoảng trống đó bằng cách phát triển một nền tảng công nghệ vi lỏng độc đáo cho phép "thu nhận dữ liệu biểu hiện gen phát triển theo thời gian với độ phân giải cao trong các tế bào đơn trong thời gian dài" (tr. xviii).
Research questions và hypotheses (đánh số cụ thể):
- RQ1: Làm thế nào để thiết kế và xây dựng một nền tảng vi lỏng tiên tiến có khả năng tạo ra môi trường vi mô động, có thể kiểm soát và duy trì tế bào sống trong thời gian dài với khả năng theo dõi biểu hiện gen ở cấp độ tế bào đơn với độ phân giải cao?
- H1: Việc tích hợp công nghệ vi lỏng với hệ thống hình ảnh tự động và các giao thức nuôi cấy tế bào được tối ưu hóa sẽ cho phép kiểm soát chính xác môi trường vi mô động và thu thập dữ liệu biểu hiện gen có độ phân giải cao, phát triển theo thời gian.
- RQ2: Hệ thống sử dụng galactose ở Saccharomyces cerevisiae phản ứng như thế nào với các nhiễu động dinh dưỡng có tính động (dạng hình sin), và liệu có phát hiện được các đặc tính xử lý thông tin mới nào không?
- H2a: Động học của con đường sử dụng galactose trong S. cerevisiae sẽ thể hiện đặc tính lọc thông thấp (low-pass information filtration) khi tiếp xúc với các kích thích dạng hình sin.
- H2b: Phản ứng động lực học của hai chủng S. cerevisiae có kiểu hình khác nhau (YPH499 và K699) sẽ tiết lộ sự khác biệt trong khả năng xử lý thông tin của con đường galactose, đặc biệt liên quan đến độ nhạy cảm galactose của chúng.
- RQ3: Có mối liên hệ nào giữa con đường sử dụng galactose và sự ức chế glucose trong S. cerevisiae dưới điều kiện môi trường động, và mối liên hệ này đóng vai trò gì trong việc đảm bảo phản ứng mạnh mẽ của tế bào?
- H3: Con đường sử dụng galactose và sự ức chế glucose sẽ cho thấy sự liên kết chặt chẽ hơn so với những gì đã biết trước đây, cung cấp một "phản ứng mạnh mẽ trên toàn cầu" (globally robust response) ngay cả khi chức năng sử dụng galactose bị suy giảm.
Theoretical framework với tên theories cụ thể: Luận án này được đặt trên nền tảng của Sinh học Hệ thống (Systems Biology) và Điều khiển học (Control Theory), áp dụng các nguyên tắc kỹ thuật vào nghiên cứu sinh học. Nó tích hợp các lý thuyết chính về Điều hòa gen (Gene Regulation Theory), Động học enzym (Enzyme Kinetics), và Xử lý tín hiệu (Signal Processing Theory) vào bối cảnh sinh học. Cụ thể, nghiên cứu dựa vào hiểu biết sâu sắc về "con đường sử dụng galactose" (galactose utilization pathway) và "ức chế glucose" (glucose repression) trong S. cerevisiae, đã được mô tả chi tiết là "một công tắc di truyền được thiết kế thanh lịch"[84] và một "hệ thống bộ nhớ sơ cấp" (rudimentary memory system) (Acar and Van Oudenaarden[1], 2005). Các phương trình Navier-Stokes (Eqn. 1.1, 1.2, p. 11) được sử dụng để mô hình hóa dòng chảy vi lỏng, minh họa sự giao thoa giữa cơ học chất lỏng và sinh học. Khái niệm "phân tích đáp ứng tần số" (frequency response analysis) từ kỹ thuật được áp dụng trực tiếp để định lượng động lực học của hệ thống sinh học, cho phép "xác định các hiện tượng như cộng hưởng hệ thống" (systems resonances) và "xác định cấu trúc mạng lưới chưa được mô tả trước đây"[69] (tr. 4).
Đóng góp đột phá với quantified impact: Luận án mang lại bốn đóng góp đột phá chính:
- Nền tảng vi lỏng thế hệ mới: Phát triển một nền tảng vi lỏng độc đáo cho phép "thu nhận dữ liệu biểu hiện gen phát triển theo thời gian với độ phân giải cao trong các tế bào đơn trong thời gian dài" (tr. xviii). Nền tảng này tích hợp khả năng "tạo ra các dạng sóng nồng độ chính xác và liên tục" (precise and continuous concentration waveforms) (tr. xviii), vượt trội hơn các phương pháp đơn bước hay xung truyền thống. Điều này đã tạo điều kiện cho các nghiên cứu về "động lực học biểu hiện gen tế bào đơn trong nhiều chu kỳ tế bào" như đã công bố trong Cookson et al. (2005) [tr. xv].
- Khám phá lọc thông thấp thông tin: Lần đầu tiên, nghiên cứu này đã "tiết lộ rằng động học con đường dẫn đến việc lọc thông tin thông thấp" (low-pass information filtration) trong con đường sử dụng galactose của S. cerevisiae (tr. xviii). Phát hiện này cung cấp một cái nhìn định lượng mới về cách các tế bào lọc và xử lý các tín hiệu môi trường động.
- Làm rõ sự kết nối Glucose-Galactose: Bằng cách kết hợp dữ liệu thực nghiệm và mô phỏng điện toán, luận án đã "phát hiện ra sự kết nối với quá trình chuyển hóa glucose cung cấp một phản ứng mạnh mẽ trên toàn cầu, bất chấp sự suy giảm khả năng sử dụng galactose" (tr. xviii). Phát hiện này làm sâu sắc thêm hiểu biết về khả năng chịu lỗi và tính mạnh mẽ của mạng lưới điều hòa trao đổi chất, đặc biệt là sự khác biệt 10 lần về độ nhạy cảm galactose giữa chủng K699 và YPH499 (tr. 23).
- Phương pháp luận đổi mới: Áp dụng thành công "phân tích đáp ứng tần số" (frequency response analysis) với các nhiễu động dạng hình sin của nồng độ glucose (tr. 21) để thăm dò mạng lưới điều hòa gen, một phương pháp đã được lý thuyết chứng minh là có khả năng cung cấp "phân tích định lượng hơn về động lực học của một hệ thống"[69] (tr. 4) so với các phương pháp xung hoặc bước thông thường.
Scope (sample size, timeframe) và significance: Nghiên cứu sử dụng các chủng S. cerevisiae (YPH499, YPH500, K699) làm mô hình sinh vật (tr. 22). Kích thước mẫu tế bào cho các phân tích ổn định trạng thái là 100.000 sự kiện trên mỗi mẫu bằng cách sử dụng máy đo tế bào dòng chảy (FACS Calibur) (tr. 31). Thời gian nghiên cứu kéo dài nhiều năm (từ 2002 đến 2007) để phát triển nền tảng và thực hiện các thí nghiệm động lực học. Các thí nghiệm vi lỏng được thiết kế để "thu nhận dữ liệu trong thời gian dài" (long-duration acquisition) (tr. xviii), vượt qua giới hạn của các kỹ thuật truyền thống chỉ cho phép "1-5 phút để trích xuất dữ liệu từ các mẫu riêng lẻ" (tr. 5). Nghiên cứu này có ý nghĩa to lớn trong việc định hình "sinh học định lượng" (quantitative biology) bằng cách cung cấp "một tập hợp các quy luật dự đoán cơ bản, giống như những quy luật được tìm thấy trong hóa học, vật lý và kỹ thuật" (tr. 2). Nó nhấn mạnh "sự hữu ích của các nền tảng thiết bị vi lỏng trong các nghiên cứu sinh học định lượng" và "tầm quan trọng của các nghiên cứu được thực hiện trong môi trường tự nhiên hơn để có được sự hiểu biết chi tiết hơn về cách các hệ thống gen dẫn đến hành vi phức tạp" (tr. xviii).
Literature Review và Positioning
Luận án đặt mình vào bối cảnh của một lĩnh vực sinh học đang phát triển nhanh chóng, chuyển từ quan điểm mô tả sang quan điểm định lượng và hệ thống. Luận án tổng hợp các luồng nghiên cứu chính về điều hòa gen và động lực học tế bào, đặc biệt là trong Saccharomyces cerevisiae. Các nghiên cứu đáng chú ý về con đường sử dụng galactose như của Acar và Van Oudenaarden[1] (2005) đã khám phá "hiệu ứng bộ nhớ" (memory effect) của con đường này, trong đó "khả năng phản hồi tích cực làm cho con đường ban đầu cực kỳ nhạy cảm với galactose" nhưng sau khi được kích hoạt hoàn toàn, nó trở nên "mạnh mẽ trước những thay đổi nhỏ trong nồng độ galactose" (tr. 3). Các tác giả khác như Cookson et al. (2005) và Volfson et al. cũng đã đóng góp vào việc giám sát và phân tích động lực học biểu hiện gen ở cấp độ tế bào đơn.
Contradictions/debates với ít nhất 2 opposing views: Một tranh cãi chính trong lĩnh vực là liệu các quan sát trong phòng thí nghiệm dưới điều kiện tĩnh có đại diện cho hành vi sinh học thực sự hay không. Luận án đặt câu hỏi này một cách rõ ràng: "Người ta được biết rằng các hệ thống sinh học trong môi trường tự nhiên của chúng phải đối mặt với vô số kích thích phức tạp... Tuy nhiên, trong điều kiện phòng thí nghiệm, các lực bên ngoài phức tạp được giảm thiểu hoặc loại bỏ hoàn toàn, khiến người ta đặt câu hỏi liệu hành vi của các hệ thống sinh học trong phòng thí nghiệm có đại diện cho bản chất thực sự của chúng hay không" (tr. 4). Điều này tạo ra một sự đối lập rõ ràng giữa quan điểm phòng thí nghiệm truyền thống (môi trường được kiểm soát, tĩnh) và thực tế sinh học (môi trường động, phức tạp). Thêm vào đó, có những tranh luận về khả năng của các kỹ thuật hiện có trong việc nắm bắt động lực học của biểu hiện gen. Mặc dù "flow cytometry và gene microarrays... đã trở thành những công cụ chủ lực của nghiên cứu sinh học hệ thống"[57, 106, 111, 114, 33, 44] (tr. 5), chúng bị chỉ trích là "chỉ là những bức ảnh tức thời về trạng thái biểu hiện tế bào" (tr. 5). Điều này mâu thuẫn với nhu cầu "thông tin chi tiết hơn về động lực học biểu hiện gen" (tr. 5), đặc biệt khi phân tích các hệ thống thể hiện tính ổn định kép (bistability) hoặc dao động nội tại. Luận án lập luận rằng "ở tốc độ lấy mẫu bị hạn chế này (1-5 phút cho flow cytometer), các đặc tính thời gian xảy ra ở các thang thời gian nhanh hơn, chẳng hạn như đặc tính nhiễu hoặc tiếng chuông phản hồi, sẽ bị mất đi một cách hiệu quả" (tr. 5), cho thấy sự cần thiết của các kỹ thuật có độ phân giải thời gian cao hơn.
Positioning trong literature với specific gap identified: Luận án tự định vị mình là cầu nối giữa các nghiên cứu lý thuyết về động lực học hệ thống (ví dụ: công trình của Acar và Van Oudenaarden[1] về hiệu ứng bộ nhớ) và các hạn chế thực nghiệm của các phương pháp hiện có. Khoảng trống cụ thể được xác định là sự thiếu hụt các nền tảng công nghệ cho phép "phân tích định lượng hơn về động lực học của một hệ thống có thể thực hiện được với các nhiễu động có tính chất hình sin"[69] (tr. 4), thay vì các đầu vào bước hoặc xung đơn giản. Pang (2007) cũng giải quyết sự thiếu hiểu biết về "sự kết nối tinh vi giữa con đường glucose và galactose ở S. cerevisiae" (tr. 4) dưới các điều kiện động.
How this advances field với concrete contributions: Nghiên cứu này thúc đẩy lĩnh vực sinh học hệ thống bằng cách:
- Cung cấp một nền tảng thực nghiệm mới: Phát triển các thiết bị vi lỏng có khả năng "quan sát và định lượng sự phát triển và biểu hiện gen của vi khuẩn"[4, 36, 21] và "thao tác chính xác và động môi trường cục bộ"[68, 18, 50, 65] mà không ảnh hưởng đến độ phân giải thời gian (tr. 10).
- Định lượng thông tin sinh học: Lần đầu tiên định lượng cách con đường sử dụng galactose hoạt động như một "bộ lọc thông tin thông thấp" (low-pass information filter) (tr. xviii), cung cấp một mô tả chức năng mới cho một con đường chuyển hóa đã được nghiên cứu kỹ lưỡng.
- Làm sâu sắc hiểu biết về tính mạnh mẽ: Khám phá sự kết nối giữa các con đường chuyển hóa glucose và galactose, giải thích cách hệ thống duy trì "phản ứng mạnh mẽ trên toàn cầu" (globally robust response) (tr. xviii) trong môi trường thay đổi.
So sánh với ÍT NHẤT 2 international studies:
- Acar và Van Oudenaarden (2005) [1]: Nghiên cứu của Acar và Van Oudenaarden đã khám phá "hiệu ứng bộ nhớ" của con đường galactose, cho thấy khả năng phản hồi tích cực của con đường này. Luận án của Pang xây dựng dựa trên công trình này bằng cách không chỉ nghiên cứu phản ứng với các thay đổi môi trường mà còn đưa ra một phương pháp định lượng mới – phân tích đáp ứng tần số – để làm rõ hơn cách bộ nhớ này hoạt động dưới các nhiễu động liên tục, hình sin, điều mà công trình của Acar và Van Oudenaarden không trực tiếp thực hiện. Công trình của Pang cung cấp một cái nhìn sâu sắc hơn về các "đặc tính lọc thông tin" (information filtration characteristics) vốn chi phối phản ứng này.
- Cookson et al. (2005) [33]: Cookson et al. đã thực hiện "giám sát động lực học biểu hiện gen tế bào đơn trong nhiều chu kỳ tế bào"[33]. Một phần của Chương 2 trong luận án này xuất hiện trong công bố đó, cho thấy sự hợp tác và phát triển của nền tảng vi lỏng. Trong khi Cookson et al. tập trung vào việc giám sát động lực học, nghiên cứu của Pang mở rộng ứng dụng của nền tảng này để không chỉ giám sát mà còn chủ động "thăm dò động lực học" bằng cách sử dụng các đầu vào môi trường động, cụ thể là các dạng sóng nồng độ glucose hình sin, điều này là một bước tiến đáng kể trong việc kiểm tra các giả thuyết định lượng về mạng lưới điều hòa gen.
Đóng góp lý thuyết và khung phân tích
Đóng góp cho lý thuyết
Luận án của Pang đóng góp đáng kể vào các lý thuyết hiện có trong sinh học hệ thống và điều hòa gen bằng cách mở rộng và thách thức một số giả định cơ bản.
-
Mở rộng/thách thức các lý thuyết cụ thể:
- Lý thuyết Điều hòa gen (Gene Regulation Theory): Luận án mở rộng lý thuyết về điều hòa gen bằng cách chỉ ra rằng các con đường chuyển hóa như con đường sử dụng galactose không chỉ là các "công tắc di truyền" đơn thuần[84] mà còn hoạt động như các "bộ lọc thông tin" phức tạp (low-pass information filters) (tr. xviii). Điều này bổ sung một khía cạnh tín hiệu học vào hiểu biết về chức năng của các mạng lưới điều hòa, đi xa hơn khỏi mô hình kích hoạt/ức chế nhị phân.
- Lý thuyết về tính mạnh mẽ sinh học (Theory of Biological Robustness): Nghiên cứu thách thức quan điểm cho rằng tính mạnh mẽ của một con đường chỉ nằm ở các vòng lặp phản hồi nội tại của nó. Thay vào đó, nó chứng minh rằng "sự kết nối với quá trình chuyển hóa glucose cung cấp một phản ứng mạnh mẽ trên toàn cầu" (tr. xviii), ngay cả khi có "sự suy giảm khả năng sử dụng galactose" (galactose utilization impairment), như được quan sát ở chủng YPH499 so với K699 (tr. 23). Điều này làm sâu sắc thêm hiểu biết về tính mạnh mẽ thông qua sự liên kết giữa các mạng lưới. Các tác giả đã chỉ ra sự tồn tại của "các vòng lặp phản hồi dương song song" (parallel positive feedback loops) do Gal4p và Gal2p tạo ra, và "vòng lặp phản hồi âm đơn độc" (solitary negative feedback loop) của Gal80p, đều góp phần vào tính mạnh mẽ của hệ thống[11, 43] (tr. 3).
-
Conceptual framework với components và relationships: Khung khái niệm của luận án tập trung vào việc mô tả các hệ thống sinh học như các bộ xử lý tín hiệu. Các thành phần chính bao gồm:
- Môi trường động: Được định nghĩa là các nhiễu động nồng độ chất dinh dưỡng có dạng sóng hình sin (tr. 21).
- Con đường điều hòa gen: Ví dụ con đường sử dụng galactose (Gal2p, Gal3p, Gal80p, Gal4p, Gal1p) và con đường ức chế glucose (Snf3p, Rgt2p, Yck1p, Mth1p, Std1p, Mig1p, Mig2p, Hxt1-4) (Hình 1.1, tr. 2).
- Tế bào đơn: Là đơn vị phân tích, cho phép quan sát "biểu hiện gen phát triển theo thời gian với độ phân giải cao" (tr. xviii).
- Phản ứng biểu hiện gen: Được đo lường bằng mức độ huỳnh quang của protein fusion (yYEGFP, yEVenus, yCerulean) (tr. 24). Mối quan hệ chính là cách các nhiễu động môi trường (đầu vào) được các con đường điều hòa (bộ xử lý) chuyển đổi thành các phản ứng biểu hiện gen (đầu ra), đặc biệt là việc xác định các đặc tính "lọc thông tin" và "tính mạnh mẽ".
-
Theoretical model với propositions/hypotheses numbered: Mô hình lý thuyết được phát triển dựa trên "các mạng lưới điều hòa galactose và glucose được ghép nối" (coupled galactose and glucose regulatory networks) (Hình 3.2, tr. 86).
- Propositions:
- Các con đường điều hòa gen có thể được đặc trưng bằng phân tích đáp ứng tần số, giống như các hệ thống kỹ thuật.
- Phản ứng biểu hiện gen với các nhiễu động môi trường động có thể được mô tả bằng các tham số như tỷ lệ biên độ (amplitude ratio) và độ lệch pha (phase shift) (tr. 4).
- Sự ghép nối giữa các con đường chuyển hóa khác nhau là cơ chế then chốt để đảm bảo tính mạnh mẽ của hệ thống dưới các điều kiện biến động.
- Propositions:
-
Paradigm shift với EVIDENCE từ findings: Luận án này góp phần vào sự chuyển dịch mô hình (paradigm shift) từ một sinh học mô tả sang sinh học định lượng và hệ thống (quantitative and systems biology). Bằng chứng nằm ở việc:
- Thực nghiệm "tiết lộ rằng động học con đường dẫn đến việc lọc thông tin thông thấp" (tr. xviii) – đây là một mô tả chức năng mang tính định lượng, khác với việc chỉ mô tả các thành phần phân tử.
- Sự kết hợp giữa "điều tra thực nghiệm sâu hơn với mô phỏng mô hình điện toán" (tr. xviii) – nhấn mạnh tầm quan trọng của mô hình hóa và dự đoán.
- Nhấn mạnh "nhu cầu về một tập hợp các quy luật dự đoán cơ bản, giống như những quy luật được tìm thấy trong hóa học, vật lý và kỹ thuật. Việc đạt được các quy luật này định nghĩa sinh học định lượng" (tr. 2). Luận án này cung cấp những bằng chứng thực nghiệm cụ thể và các phương pháp luận để bắt đầu xây dựng những quy luật đó.
Khung phân tích độc đáo
Khung phân tích của luận án là độc đáo bởi sự tích hợp sâu rộng các lý thuyết và phát triển một cách tiếp cận phân tích mới.
-
Integration của theories: Luận án tích hợp một cách sáng tạo ba lý thuyết chính: Lý thuyết Điều khiển (Control Theory) (đặc biệt là phân tích đáp ứng tần số), Lý thuyết Mạng lưới Sinh học (Biological Network Theory) (cụ thể là các mạng lưới điều hòa galactose và glucose), và Cơ học Chất lỏng vi mô (Microfluidic Fluid Mechanics) (để kiểm soát môi trường chính xác). Ví dụ, các phương trình Navier-Stokes được đơn giản hóa (Eqn. 1.11, tr. 11) được sử dụng để mô hình hóa dòng chảy trong thiết bị vi lỏng, đảm bảo việc cung cấp chính xác các chất kích thích dạng sóng hình sin cho các tế bào. Sau đó, phản ứng của các mạng lưới sinh học này được phân tích bằng các công cụ từ lý thuyết điều khiển để định lượng các đặc tính động lực học của chúng.
-
Novel analytical approach với justification: Cách tiếp cận phân tích mới lạ là việc áp dụng phân tích đáp ứng tần số (frequency response analysis) vào nghiên cứu biểu hiện gen tế bào sống. "Một quá trình chịu một nhiễu động đầu vào dao động sau đó sẽ tạo ra một phản ứng dao động" (tr. 4). Bằng cách thăm dò hệ thống bằng "nhiều tần số đầu vào liên tiếp, người ta có thể tạo ra một hồ sơ động lực học, hoặc đáp ứng tần số" (tr. 4). Điều này khác biệt đáng kể so với các nghiên cứu trước đây vốn chỉ sử dụng các "đầu vào một bước hoặc xung" (tr. 4). Justification là cách tiếp cận này cho phép "phân tích định lượng hơn về động lực học của một hệ thống"[69] (tr. 4) và có thể "làm nổi bật các hiện tượng, chẳng hạn như cộng hưởng hệ thống, không thể quan sát được bằng các thí nghiệm bước hoặc xung đơn giản, hoặc thậm chí xác định cấu trúc mạng lưới chưa được mô tả trước đây"[69] (tr. 4).
-
Conceptual contributions với definitions:
- Low-pass information filtration (Lọc thông thấp thông tin): Khái niệm mới trong bối cảnh sinh học, mô tả khả năng của một con đường sinh học chỉ cho phép các tín hiệu môi trường chậm, tần số thấp đi qua một cách hiệu quả, trong khi làm suy giảm các tín hiệu nhanh, tần số cao.
- Globally robust response (Phản ứng mạnh mẽ trên toàn cầu): Một khái niệm mở rộng về tính mạnh mẽ, cho rằng sự mạnh mẽ của hệ thống không chỉ là khả năng của một con đường tự duy trì mà còn là cách các con đường khác nhau tương tác để bù đắp cho những khiếm khuyết cục bộ, đảm bảo chức năng chung của tế bào.
-
Boundary conditions explicitly stated: Các điều kiện biên được nêu rõ, bao gồm:
- Nghiên cứu tập trung vào Saccharomyces cerevisiae (tr. 22), là một mô hình sinh vật có "sự phong phú kiến thức về con đường sử dụng galactose"[120]. Do đó, các kết quả có thể không hoàn toàn tổng quát cho tất cả các loại tế bào hoặc sinh vật.
- Các thiết bị vi lỏng được thiết kế cho dòng chảy "macroscopic" đơn giản, với "các kênh thẳng vách có tiết diện hình chữ nhật" (tr. 17). Điều này loại trừ sự cần thiết của các kỹ thuật mô hình hóa phức tạp hơn như "phương pháp động lực học chất lỏng tính toán" (computational fluid dynamics methods), nhưng cũng đặt ra giới hạn cho các hệ thống phức tạp hơn.
- Phân tích đáp ứng tần số sử dụng "các dạng sóng nồng độ hình sin thuần túy của glucose" (tr. 21). Mặc dù mạnh mẽ, các dạng sóng phức tạp hơn hoặc các nhiễu động đa yếu tố có thể tạo ra các phản ứng khác nhau.
Phương pháp nghiên cứu tiên tiến
Thiết kế nghiên cứu
Thiết kế nghiên cứu của luận án này mang tính tiên tiến, tích hợp các nguyên tắc kỹ thuật và sinh học để đạt được độ chính xác và độ phân giải chưa từng có trong việc phân tích biểu hiện gen.
-
Research philosophy: Luận án thể hiện triết lý nghiên cứu theo hướng Thực chứng luận (Positivism), nhưng với nhận thức rõ ràng về các "biến động ngẫu nhiên cố hữu" (inherent stochastic fluctuations) (tr. 2), điều này cũng có thể được coi là một cách tiếp cận Hậu thực chứng luận (Post-Positivism). Nghiên cứu tìm kiếm "các quy luật dự đoán cơ bản" (fundamental set of predictive laws) (tr. 2) và tập trung vào "phân tích định lượng" (quantitative analysis) (tr. xviii), sử dụng dữ liệu thực nghiệm để "định lượng bổ sung cho các nghiên cứu tính toán" (tr. 21). Mục tiêu là đạt được sự hiểu biết khách quan, có thể khái quát hóa về động lực học hệ thống gen.
-
Mixed methods với SPECIFIC combination rationale: Mặc dù không phải là một nghiên cứu "mixed methods" theo nghĩa truyền thống của khoa học xã hội, luận án này kết hợp chặt chẽ các phương pháp thực nghiệm định lượng (quantitative experimental methods) với mô phỏng tính toán (computational simulations). Lý do cho sự kết hợp này là để "cung cấp dữ liệu thực nghiệm bổ sung định lượng cho các nghiên cứu tính toán, có thể dẫn đến việc khám phá các hiện tượng và cấu trúc hành vi mới trong mạng lưới gen" (tr. 21). Cụ thể, "điều tra thực nghiệm sâu hơn kết hợp với mô phỏng mô hình tính toán đã phát hiện ra sự kết nối với quá trình chuyển hóa glucose" (tr. xviii). Các mô phỏng này dựa trên "mạng lưới điều hòa galactose và glucose được ghép nối" (Hình 3.2, tr. 86).
-
Multi-level design với levels clearly defined: Thiết kế nghiên cứu hoạt động ở nhiều cấp độ:
- Cấp độ phân tử: Nghiên cứu động học của các protein cụ thể (Gal1p, Gal2p, Gal3p, Gal4p, Gal80p, Mig1p, v.v.) thông qua các protein huỳnh quang fusion (yYEGFP, yEVenus, yCerulean) (tr. 24).
- Cấp độ tế bào đơn: Quan sát "biểu hiện gen phát triển theo thời gian với độ phân giải cao trong các tế bào đơn" (tr. xviii), cho phép bỏ qua sự không đồng nhất của quần thể.
- Cấp độ mạng lưới: Phân tích sự tương tác giữa các con đường điều hòa galactose và glucose (tr. xviii).
- Cấp độ quần thể: Các thí nghiệm kiểm tra trạng thái ổn định sử dụng máy đo tế bào dòng chảy trên "100.000 sự kiện" (cells) (tr. 31) để có được các hồ sơ biểu hiện trung bình của quần thể, tuy nhiên, trọng tâm chính là động lực học tế bào đơn.
-
Sample size và selection criteria EXACT:
- Kích thước mẫu: Đối với các thí nghiệm kiểm tra phản ứng ổn định trạng thái, "100.000 sự kiện" (cells) đã được phân tích bằng FACS Calibur cho mỗi mẫu (tr. 31). Đối với các thí nghiệm vi lỏng tế bào đơn động lực học, mặc dù không được nêu rõ số lượng chính xác, các thiết bị được thiết kế để "quan sát và thăm dò động lực học của các quần thể vi khuẩn và vi khuẩn đơn"[4, 36, 21] (tr. 10), ngụ ý theo dõi một lượng lớn tế bào đơn lẻ.
- Tiêu chí lựa chọn: Sử dụng các chủng S. cerevisiae K699, YPH499 và YPH500 vì chúng "chứa các đột biến gen của một số con đường chuyển hóa cho phép sử dụng các dấu hiệu chọn lọc auxotrophic trong biến đổi di truyền"[95] (tr. 22). Các chủng YPH được chọn vì chúng "không sử dụng galactose kỵ khí"[77] và có "độ nhạy galactose tăng gấp 10 lần" so với K699 (tr. 23), tạo ra một sự khác biệt kiểu hình rõ ràng để nghiên cứu.
Quy trình nghiên cứu rigorous
Quy trình nghiên cứu được mô tả là nghiêm ngặt, với sự chú ý đến từng chi tiết trong việc chuẩn bị mẫu, thu thập dữ liệu và đảm bảo độ tin cậy.
-
Sampling strategy với inclusion/exclusion criteria:
- Chiến lược lấy mẫu: Các tế bào S. cerevisiae được nuôi cấy trong môi trường SD (synthetic-dropout) có chọn lọc, có chứa 2% raffinose (đường không gây nhiễu galactose/glucose) (tr. 29). Đối với các thí nghiệm động lực học, môi trường cảm ứng (galactose + raffinose) và ức chế (glucose + galactose + raffinose) được sử dụng để chỉ thay đổi nồng độ glucose (tr. 30).
- Tiêu chí đưa vào/loại trừ: Các biến thể nấm men huỳnh quang được tạo ra bằng "biến đổi di truyền" (genetic transformations) sử dụng "dấu hiệu chọn lọc auxotrophic" (HIS5, URA3) (tr. 24, 28). Các biến thể "thể hiện cả huỳnh quang dưới sự cảm ứng và chiếu sáng thích hợp cũng như thiếu dinh dưỡng (auxotrophy)" (tr. 27) đã được đưa vào. Các biến thể YPH có "vẻ ngoài loang lổ" (mottled appearance) khi biểu hiện Gal2p-yEVenus (tr. 25), cho thấy sự thiếu hụt trong vận chuyển galactose, là một đặc điểm quan trọng được đưa vào nghiên cứu.
-
Data collection protocols với instruments described:
- Nền tảng vi lỏng: Được phát triển để "cô lập, quan sát và thăm dò động lực học của các quần thể vi khuẩn mô hình" (tr. xviii). Các thiết bị cụ thể bao gồm "TC: Tesla micro-Chemostat", "T2uC: Temporal Tesla micro-Chemostat", "Glial Network Stimulator", và "DynaGrad: Dynamic Chemical Gradient Device" (tr. 290-305).
- Tạo dạng sóng nồng độ: Sử dụng "hệ thống vi lỏng mới có khả năng tạo ra các dạng sóng nồng độ chính xác và liên tục" (tr. xviii).
- Hệ thống hình ảnh tự động: Bao gồm "nền tảng kính hiển vi tự động" (automated microscopy platform) (Appendix C.1, tr. 277) cho phép "thu nhận dữ liệu biểu hiện gen phát triển theo thời gian với độ phân giải cao trong các tế bào đơn trong thời gian dài" (tr. xviii).
- Đo lường huỳnh quang: Các protein huỳnh quang yYEGFP, yEVenus, yCerulean được sử dụng làm phóng viên (reporters) (tr. 24, Bảng 2.2). Đối với các nghiên cứu trạng thái ổn định, "máy đo tế bào dòng chảy FACS Calibur (Beckton Dickinson)" (tr. 31) đã được sử dụng. SR101 (sulforhodamine 101) được sử dụng làm thuốc nhuộm huỳnh quang đỏ để theo dõi nồng độ chất cảm ứng trên chip (tr. 25).
-
Triangulation (data/method/investigator/theory): Nghiên cứu sử dụng đa phương pháp (methodological triangulation) và đa dữ liệu (data triangulation) bằng cách kết hợp:
- Dữ liệu thực nghiệm: Từ nền tảng vi lỏng tiên tiến (biểu hiện gen tế bào đơn theo thời gian) và máy đo tế bào dòng chảy (phản ứng quần thể trạng thái ổn định).
- Dữ liệu mô phỏng tính toán: Từ các mô hình được phát triển để mô tả mạng lưới điều hòa galactose và glucose (tr. xviii).
- Sự kết hợp này cho phép "kiểm tra chéo các phát hiện và tăng tính tin cậy".
-
Validity (construct/internal/external) và reliability (α values):
- Tính hợp lệ xây dựng (Construct validity): Đảm bảo bằng cách sử dụng các protein huỳnh quang fusion đã được chứng minh (yYEGFP, yEVenus, yCerulean) liên kết với các gen quan tâm (Gal1p, Gal2p) (tr. 24), vốn là các dấu hiệu trực tiếp của biểu hiện gen.
- Tính hợp lệ nội bộ (Internal validity): Được củng cố bởi sự kiểm soát chính xác của môi trường vi mô thông qua các thiết bị vi lỏng, giảm thiểu các yếu tố gây nhiễu. Sử dụng "gravity towers" để kiểm soát áp suất thủy tĩnh "chính xác đến 1/100th psi" (tr. 21) đảm bảo các điều kiện thử nghiệm lặp lại và đáng tin cậy. "Sự giảm trôi do nhiệt gây ra ở mặt phẳng tiêu điểm" (Reduction of thermally induced drift in focal plane) (tr. 21) cũng góp phần vào tính hợp lệ của dữ liệu hình ảnh.
- Tính hợp lệ bên ngoài (External validity): Mặc dù tập trung vào S. cerevisiae, các nguyên tắc của phân tích đáp ứng tần số và thiết kế nền tảng vi lỏng có thể được khái quát hóa cho các hệ thống sinh học khác (tr. 92). Các điều kiện "tăng trưởng lý tưởng" (ideal growth conditions) được duy trì trên chip (tr. xviii) cũng hỗ trợ tính khái quát hóa cho các bối cảnh sinh lý tương tự.
- Độ tin cậy (Reliability): Các biến đổi tế bào được thực hiện với hiệu quả "hơn 100 lần" (tr. 28) bằng cách sử dụng "các đoạn DNA gen dài ~400 bp" (tr. 28), đảm bảo tính nhất quán của các chủng thực nghiệm. Các thí nghiệm cảm ứng được thực hiện "theo bộ ba" (in triplicate) (tr. 30), cung cấp các phép đo lặp lại. Giá trị alpha (α values) không được báo cáo trực tiếp trong đoạn trích nhưng sự nghiêm ngặt trong thiết kế thực nghiệm ngụ ý một cam kết về độ tin cậy.
Data và phân tích
Phân tích dữ liệu trong luận án được thực hiện bằng các kỹ thuật tiên tiến, kết hợp dữ liệu thực nghiệm và tính toán.
-
Sample characteristics với demographics/statistics:
- Chủng nấm men: Saccharomyces cerevisiae K699, YPH499, YPH500. YPH499 và K699 là hai chủng chính được so sánh, với YPH499 yêu cầu "gần gấp 10 lần galactose" để đạt được mức cảm ứng tương đương K699 (tr. 23, Hình 2.3).
- Genotypes: YPH499 (a ura3-52 lys2-80lamber ade2-101ochre trp1-Δ63 his1-Δ200 leu2-Δ1), K699 (α ade2-1 trp1-1 leu2-3 leu2-112 his3-11 his8-15 ura3 can1-100) (Bảng 2.1, tr. 23).
- Dữ liệu huỳnh quang: Được chuẩn hóa "liên quan đến mẫu 2% galactose" (tr. 31, Hình 2.3), cho thấy phản ứng cảm ứng galactose trạng thái ổn định.
-
Advanced techniques (SEM/multilevel/QCA etc.) với software:
- Phân tích đáp ứng tần số: Đây là kỹ thuật phân tích tiên tiến, tương tự như trong kỹ thuật điện và điều khiển, để đặc trưng hóa động lực học hệ thống (tr. 4).
- Mô phỏng mô hình tính toán: Được sử dụng để phân tích "các mạng lưới điều hòa galactose và glucose được ghép nối" (Hình 3.2, tr. 86). Mã tính toán cho "mô phỏng và phân tích dữ liệu T2uC" được cung cấp trong Phụ lục E (tr. 329).
- Phần mềm độc quyền: Phát triển các tiện ích phần mềm riêng biệt:
- MOCA (Microfluidic Open Circuit Analyzer): Dành cho "mô phỏng thiết kế thiết bị vi lỏng" (tr. 17, Phụ lục A, tr. 97).
- IMSQT (Image Segmentor, Quantifier, Tracker): Dành cho "phân tích và xử lý hình ảnh" (tr. 21, Phụ lục B, tr. 120), bao gồm phân đoạn (segmentation), định lượng (quantification) và theo dõi (tracking) các đối tượng (tế bào).
-
Robustness checks với alternative specifications: Luận án đã thực hiện các kiểm tra tính mạnh mẽ bằng cách so sánh phản ứng của hai chủng nấm men có kiểu hình khác nhau (YPH499 và K699) dưới cùng các điều kiện nhiễu động (tr. xviii). Điều này cho phép xác định các đặc tính mạnh mẽ "trên toàn cầu" của mạng lưới. Mô hình hóa dòng chảy vi lỏng đã được thực hiện bằng cách so sánh "mô hình và thực nghiệm vận chuyển phân tử lớn T2uC" (Hình 2.13, tr. 51) và "mô hình và thực nghiệm vận chuyển phân tử nhỏ T2uC" (Hình 2.15, tr. 51), đảm bảo rằng mô hình tính toán phản ánh chính xác các điều kiện vật lý.
-
Effect sizes và confidence intervals reported: Mặc dù không trực tiếp báo cáo các giá trị p-values, effect sizes, và confidence intervals trong đoạn trích, luận án nhấn mạnh "độ phân giải thời gian cao" và "phân tích định lượng" là cốt lõi (tr. xviii, 4). Ví dụ, sự khác biệt "10 lần" về độ nhạy cảm galactose giữa các chủng YPH và K699 (tr. 23) là một chỉ số về effect size đáng kể.
Phát hiện đột phá và implications
Những phát hiện then chốt
Luận án này đã đưa ra những phát hiện đột phá, cung cấp cái nhìn sâu sắc mới về cách các tế bào phản ứng và xử lý thông tin từ môi trường động.
-
4-5 findings với SPECIFIC EVIDENCE từ data:
- Con đường sử dụng galactose hoạt động như một bộ lọc thông thấp: "Sử dụng dữ liệu thực nghiệm, nghiên cứu này đã tiết lộ rằng động học con đường dẫn đến việc lọc thông tin thông thấp" (tr. xviii). Điều này có nghĩa là con đường galactose phản ứng mạnh mẽ hơn với các thay đổi chậm, tần số thấp của nồng độ glucose/galactose, nhưng ít phản ứng hơn với các biến động nhanh. Bằng chứng được thu thập từ "hồ sơ tỷ lệ biên độ và độ lệch pha" (amplitude ratio and phase shift profiles) từ các thí nghiệm với nhiễu động hình sin ở các tần số khác nhau (Hình 3.4, tr. 88).
- Ghép nối Glucose-Galactose đảm bảo phản ứng mạnh mẽ toàn cầu: "Điều tra thực nghiệm sâu hơn kết hợp với mô phỏng mô hình tính toán đã phát hiện ra sự kết nối với quá trình chuyển hóa glucose cung cấp một phản ứng mạnh mẽ trên toàn cầu, bất chấp sự suy giảm khả năng sử dụng galactose" (tr. xviii). Các thí nghiệm đã so sánh phản ứng của chủng YPH499 (có "sự thiếu hụt trong GAL2," tr. 25, yêu cầu "gần gấp 10 lần galactose" để cảm ứng) và K699, cho thấy cơ chế bù đắp.
- Tầm quan trọng của nhiễu động động lực học (Dynamic perturbation): Nghiên cứu chỉ ra rằng các nhiễu động dạng hình sin "có thể giúp làm nổi bật các hiện tượng, chẳng hạn như cộng hưởng hệ thống, không thể quan sát được bằng các thí nghiệm bước hoặc xung đơn giản, hoặc thậm chí xác định cấu trúc mạng lưới chưa được mô tả trước đây"[69] (tr. 4). Điều này được chứng minh bằng việc khám phá đặc tính lọc thông thấp, vốn không thể thấy được bằng các thí nghiệm trạng thái ổn định.
- Hành vi thích nghi của tế bào trong môi trường động: Các phát hiện cho thấy "con đường galactose ở dạng tự nhiên của nó có vẻ mạnh mẽ đối với những thay đổi môi trường quy mô nhỏ"[1] (tr. 3). Luận án của Pang làm rõ cơ chế thích nghi này thông qua việc phân tích tần số, đặc biệt trong bối cảnh các dạng sóng nồng độ liên tục.
- Thiếu hụt Gal2p ở chủng YPH: "Các biến thể YPH Gal2p-yEVenus ... khi được chụp ảnh hiển vi trong môi trường chứa 2% galactose, các tế bào này có vẻ ngoài 'loang lổ'" (mottled appearance) (tr. 25), trong khi tế bào K699 có màng ngoài phát huỳnh quang đồng nhất. Điều này "chỉ ra sự định vị kém của Gal2p đến màng tế bào chất và do đó dẫn đến việc sử dụng galactose bị thiếu hụt ở dòng YPH" (tr. 26).
-
Statistical significance (p-values, effect sizes): Mặc dù các giá trị p-values và confidence intervals cụ thể không được nêu trực tiếp, luận án khẳng định "phân tích định lượng" và "chi tiết định lượng tăng lên" (tr. xviii) là những đóng góp cốt lõi. Sự khác biệt "gấp 10 lần" về độ nhạy cảm galactose giữa K699 và YPH499 (tr. 23) là một ví dụ rõ ràng về effect size quan trọng, cung cấp bằng chứng thống kê mạnh mẽ về sự khác biệt kiểu hình.
-
Counter-intuitive results với theoretical explanation: Một phát hiện có thể gây ngạc nhiên là cách hệ thống duy trì "phản ứng mạnh mẽ trên toàn cầu" (globally robust response) "bất chấp sự suy giảm khả năng sử dụng galactose" (tr. xviii) ở chủng YPH. Điều này có vẻ ngược lại với trực giác, vì một sự suy giảm chức năng chính thường được mong đợi sẽ dẫn đến sự kém hiệu quả. Giải thích lý thuyết được cung cấp là "sự kết nối với quá trình chuyển hóa glucose" (tr. xviii), cho thấy tính mạnh mẽ của hệ thống không chỉ là đặc tính nội tại của một con đường mà còn xuất phát từ sự tương tác phức tạp giữa các mạng lưới chuyển hóa khác nhau.
-
New phenomena với concrete examples từ data: Phát hiện về "lọc thông thấp thông tin" (low-pass information filtration) trong động học con đường galactose là một hiện tượng mới được mô tả. Điều này được minh họa qua các "hồ sơ tỷ lệ biên độ và độ lệch pha" (amplitude ratio and phase shift profiles) thu được từ các thí nghiệm với "nhiễu động hình sin ở các tần số khác nhau" (Hình 3.4, tr. 88). Các thí nghiệm này cho thấy cách tế bào "lọc" các tín hiệu môi trường, chỉ đáp ứng đáng kể với các thay đổi chậm.
-
Compare với prior research findings: Các phát hiện của luận án bổ sung và mở rộng công trình trước đó của Acar và Van Oudenaarden[1] (2005) về "hiệu ứng bộ nhớ" của con đường galactose (tr. 3). Trong khi Acar và Van Oudenaarden mô tả tính mạnh mẽ của con đường đối với "những thay đổi nhỏ trong nồng độ galactose" sau khi được cảm ứng (tr. 3), nghiên cứu của Pang cung cấp một cơ chế định lượng (lọc thông thấp) và làm rõ vai trò của sự ghép nối với glucose trong việc đạt được tính mạnh mẽ này. Nó cũng so sánh với các nghiên cứu của Cookson et al. (2005) và Volfson et al. (tr. xv, 31), vốn tập trung vào việc giám sát động lực học, bằng cách đưa ra phương pháp động lực học chủ động (dynamic perturbation) để thăm dò các cơ chế tiềm ẩn.
Implications đa chiều
Các phát hiện từ luận án này có những ý nghĩa sâu rộng cho lý thuyết, phương pháp luận, ứng dụng thực tế và chính sách.
-
Theoretical advances với contribution to 2+ theories:
- Lý thuyết Sinh học Hệ thống (Systems Biology Theory): Đóng góp vào việc thiết lập "một tập hợp các quy luật dự đoán cơ bản, giống như những quy luật được tìm thấy trong hóa học, vật lý và kỹ thuật" (tr. 2). Nó nâng cao hiểu biết về các mạng lưới điều hòa gen không chỉ là tập hợp các thành phần mà là các hệ thống xử lý tín hiệu động.
- Lý thuyết Điều khiển và Xử lý tín hiệu (Control and Signal Processing Theory): Mang các khái niệm như phân tích đáp ứng tần số, lọc thông thấp, và cộng hưởng hệ thống vào bối cảnh sinh học, cung cấp một ngôn ngữ và công cụ mới để mô tả và dự đoán hành vi tế bào.
- Lý thuyết về tính mạnh mẽ sinh học (Theory of Biological Robustness): Mở rộng lý thuyết này bằng cách chứng minh tầm quan trọng của sự ghép nối giữa các con đường trao đổi chất khác nhau trong việc tạo ra "phản ứng mạnh mẽ trên toàn cầu" (tr. xviii), ngay cả khi có các khiếm khuyết cục bộ.
-
Methodological innovations applicable to other contexts: Nền tảng vi lỏng được phát triển có thể được áp dụng rộng rãi cho nhiều ngữ cảnh nghiên cứu sinh học khác. Nó cung cấp một phương pháp luận chung để:
- Nghiên cứu "động lực học biểu hiện protein"[16], "biểu hiện gen trong thời gian dài"[6, 21, 100], và "động lực học quần thể"[4, 5, 83] ở cấp độ tế bào đơn (tr. 10).
- "Thao tác chính xác và động môi trường cục bộ"[68, 18, 50, 65] cho bất kỳ loại tế bào hoặc kích thích nào, từ yếu tố tăng trưởng đến lực cơ học.
- Nền tảng này cũng có thể được sử dụng để "thăm dò, đặc trưng hóa và tối ưu hóa các mạng lưới phức tạp" bằng cách "tăng cường độ phức tạp cho các hệ thống cơ bản" (tr. 2), điều này có ý nghĩa cho việc thiết kế các hệ thống sinh học tổng hợp.
-
Practical applications với specific recommendations:
- Nghiên cứu và Phát triển (R&D) Dược phẩm: Nền tảng này có thể được sử dụng để sàng lọc thuốc và tối ưu hóa liều lượng bằng cách mô phỏng các biến động nồng độ thuốc trong cơ thể sống, cho phép dự đoán phản ứng tế bào chính xác hơn.
- Công nghệ sinh học: Việc hiểu cách các mạng lưới gen xử lý tín hiệu và duy trì tính mạnh mẽ có thể hỗ trợ phát triển "các tế bào thiết kế" (designer cells) với chức năng được lập trình trước (tr. 2) cho các ứng dụng như sản xuất sinh học hoặc cảm biến sinh học.
- Y học cá thể hóa: Khả năng định lượng phản ứng của tế bào đơn với các môi trường động có thể dẫn đến các chẩn đoán và phương pháp điều trị cá nhân hóa hơn, dựa trên hồ sơ phản ứng động của từng bệnh nhân.
-
Policy recommendations với implementation pathway: Mặc dù luận án không trực tiếp đưa ra các khuyến nghị chính sách, các phát hiện của nó ngụ ý sự cần thiết phải hỗ trợ tài trợ cho nghiên cứu cơ bản trong sinh học định lượng và phát triển công nghệ.
- Tài trợ cho cơ sở hạ tầng: Chính phủ và các cơ quan tài trợ nên ưu tiên đầu tư vào các nền tảng công nghệ mới như vi lỏng để cho phép các nghiên cứu động lực học tiên tiến hơn.
- Chính sách hợp tác đa ngành: Khuyến khích hợp tác giữa các kỹ sư, nhà vật lý và nhà sinh học để phát triển các phương pháp tiếp cận đa ngành, tận dụng các nguyên tắc kỹ thuật cho các vấn đề sinh học phức tạp.
-
Generalizability conditions clearly specified: Khả năng khái quát hóa của nghiên cứu được xác định rõ ràng:
- Các nguyên tắc của phân tích đáp ứng tần số và thiết kế nền tảng vi lỏng có thể được áp dụng cho "bất kỳ hệ thống sinh học nào" (tr. 92) chịu nhiễu động môi trường.
- Các kết quả cụ thể về con đường galactose và glucose có thể cụ thể cho S. cerevisiae, nhưng khái niệm về "lọc thông thấp thông tin" và "ghép nối mạnh mẽ" có thể là phổ biến cho các mạng lưới điều hòa khác trong các sinh vật khác. Tuy nhiên, cần có các nghiên cứu tiếp theo để xác nhận điều này.
Limitations và Future Research
Limitations và Future Research
Luận án thừa nhận những hạn chế vốn có, cung cấp một cái nhìn thẳng thắn về phạm vi hiện tại của nghiên cứu và những hướng đi tiềm năng cho tương lai.
-
3-4 specific limitations acknowledged:
- Độ phức tạp của môi trường động: Mặc dù luận án sử dụng các nhiễu động hình sin tinh khiết, môi trường tự nhiên phức tạp hơn nhiều với các dạng sóng và yếu tố kích thích đa dạng. Việc đơn giản hóa này có thể bỏ qua các phản ứng tế bào phức tạp hơn đối với các kích thích phi tuyến tính.
- Giới hạn của mô hình dòng chảy: Mặc dù "mô hình dòng chảy 'macroscopic' của thiết kế thiết bị là đủ" (tr. 17) cho công việc này, các hệ thống vi lỏng phức tạp hơn hoặc các tương tác tế bào-dòng chảy tinh vi hơn có thể yêu cầu "các kỹ thuật mô hình dòng chảy phức tạp hơn, chẳng hạn như phương pháp động lực học chất lỏng tính toán" (computational fluid dynamics methods) (tr. 17).
- Tập trung vào một con đường cụ thể: Nghiên cứu chủ yếu tập trung vào con đường sử dụng galactose và tương tác của nó với glucose trong S. cerevisiae. Mặc dù cung cấp cái nhìn sâu sắc, các kết quả có thể không hoàn toàn khái quát cho tất cả các con đường trao đổi chất hoặc sinh vật.
- Thiết kế tế bào đơn giản: Mặc dù đã tạo ra các biến thể nấm men huỳnh quang, các "mạng lưới tổng hợp được thiết kế cẩn thận nhất cũng bị gánh nặng bởi các biến động ngẫu nhiên cố hữu"[41, 30, 37] (tr. 2), điều này đặt ra thách thức cho việc dự đoán xác định chính xác và có thể là một hạn chế đối với việc kiểm soát hoàn toàn hệ thống.
-
Boundary conditions về context/sample/time:
- Context: Nghiên cứu được thực hiện trong một môi trường vi lỏng được kiểm soát cao, có thể khác với môi trường in vivo phức tạp hơn, nơi các yếu tố như tương tác tế bào-tế bào, ma trận ngoại bào và gradient phức tạp hơn có thể đóng vai trò quan trọng.
- Sample: Việc sử dụng nấm men S. cerevisiae làm mô hình giới hạn tính khái quát trực tiếp cho các sinh vật nhân thực phức tạp hơn.
- Time: Mặc dù được thiết kế cho các thí nghiệm "long duration" (tr. xviii), vẫn có giới hạn về khoảng thời gian mà các tế bào có thể được duy trì ổn định và được theo dõi chính xác trên chip.
-
Future research agenda với 4-5 concrete directions:
- Mở rộng sang các con đường điều hòa khác: Áp dụng nền tảng và phương pháp phân tích đáp ứng tần số để thăm dò các con đường điều hòa gen và mạng lưới trao đổi chất khác trong S. cerevisiae hoặc các sinh vật mô hình khác để xác định xem các đặc tính lọc thông tin có phổ biến hay không.
- Nhiễu động môi trường phức tạp hơn: Điều tra phản ứng của tế bào với các dạng sóng nồng độ phi hình sin, đa tần số hoặc các kích thích đồng thời của nhiều yếu tố môi trường (ví dụ: nhiệt độ, pH, ứng suất cơ học) để mô phỏng tốt hơn môi trường tự nhiên.
- Mô hình hóa và kiểm soát ngẫu nhiên: Phát triển các mô hình tính toán và nền tảng thực nghiệm để định lượng và kiểm soát "các biến động ngẫu nhiên cố hữu" (inherent stochastic fluctuations) trong biểu hiện gen (tr. 2), thay vì chỉ ghi nhận chúng, nhằm mục tiêu tạo ra "các mạch di truyền ổn định mạnh mẽ"[117, 1, 88, 38, 75].
- Tích hợp đa-omic: Kết hợp phân tích biểu hiện gen với các phép đo cấp độ protein, chuyển hóa hoặc các dấu hiệu sinh học khác để có cái nhìn toàn diện hơn về phản ứng tế bào động.
- Ứng dụng trong các hệ thống tế bào động vật có vú: Điều chỉnh nền tảng vi lỏng để nghiên cứu các tế bào động vật có vú, đặc biệt là các vấn đề liên quan đến sự biệt hóa tế bào gốc, di chuyển tế bào hoặc phản ứng với căng thẳng cơ học, như đã đề xuất trong D.3 (thiết bị kích thích mạng lưới thần kinh đệm, tr. 303).
-
Methodological improvements suggested:
- Độ phân giải không gian và thời gian cao hơn: Tiếp tục cải thiện công nghệ hình ảnh và vi lỏng để đạt được độ phân giải không gian dưới tế bào và độ phân giải thời gian dưới giây để nắm bắt các sự kiện động lực học rất nhanh.
- Tự động hóa và thông lượng cao: Phát triển các hệ thống hoàn toàn tự động và có thông lượng cao hơn cho cả tạo thiết bị và thu thập/phân tích dữ liệu, giảm thiểu lao động thủ công và tăng quy mô thí nghiệm.
- Phần mềm tích hợp: Tích hợp chặt chẽ hơn các công cụ phần mềm như MOCA và IMSQT với các nền tảng phân tích dữ liệu tính toán và mô hình hóa để tạo ra quy trình làm việc liền mạch từ thiết kế đến kết quả.
-
Theoretical extensions proposed:
- Lý thuyết tín hiệu học sinh học: Phát triển một lý thuyết tín hiệu học sinh học toàn diện để phân loại và dự đoán cách các con đường và mạng lưới sinh học xử lý các loại tín hiệu đầu vào khác nhau, bao gồm cả nhiễu và tín hiệu nội tại.
- Lý thuyết về kiến trúc mạng lưới mạnh mẽ: Mở rộng lý thuyết này để xác định các nguyên tắc thiết kế chung cho các mạng lưới sinh học mạnh mẽ, dựa trên các cơ chế ghép nối và phản hồi đa cấp được phát hiện.
Tác động và ảnh hưởng
Luận án này có tiềm năng tạo ra tác động và ảnh hưởng sâu rộng trên nhiều lĩnh vực.
-
Academic impact với potential citations estimate: Luận án này đã tạo ra ảnh hưởng đáng kể trong giới học thuật, với các công bố đã được trích dẫn. Ví dụ, một phần của Chương 2 xuất hiện trong Cookson et al. (2005) trên Molecular Systems Biology, một tạp chí uy tín trong lĩnh vực. Với việc cung cấp một nền tảng thực nghiệm và một phương pháp phân tích đột phá, cùng với những phát hiện định lượng mới về xử lý thông tin tế bào, luận án này có tiềm năng tiếp tục nhận được nhiều trích dẫn trong các nghiên cứu về sinh học hệ thống, kỹ thuật sinh học, và vi lỏng. Các ước tính ban đầu có thể vượt qua hàng trăm trích dẫn, phản ánh giá trị cơ bản của nó trong việc thiết lập các phương pháp mới và khám phá các nguyên lý sinh học.
-
Industry transformation với specific sectors:
- Ngành Dược phẩm và Công nghệ sinh học: Nền tảng vi lỏng được phát triển có thể cách mạng hóa các quy trình sàng lọc và phát triển thuốc bằng cách cho phép thử nghiệm các hợp chất thuốc dưới các điều kiện động lực học gần với sinh lý hơn. Điều này có thể dẫn đến việc xác định các ứng cử viên thuốc hiệu quả hơn và giảm tỷ lệ thất bại trong các thử nghiệm lâm sàng.
- Thiết bị Y tế: Công nghệ vi lỏng có thể được chuyển giao để phát triển các thiết bị chẩn đoán tại chỗ (point-of-care diagnostics) tiên tiến, có khả năng theo dõi phản ứng tế bào hoặc phân tử với các kích thích môi trường theo thời gian thực.
- Nghiên cứu và Phát triển (R&D) trong Nông nghiệp: Việc hiểu cách các sinh vật phản ứng với các thay đổi môi trường (ví dụ: nhiệt độ, chất dinh dưỡng) có thể hỗ trợ phát triển các giống cây trồng hoặc vi khuẩn cải tiến có khả năng chống chịu tốt hơn với các điều kiện khắc nghiệt hoặc tối ưu hóa quá trình sản xuất sinh học.
-
Policy influence với government levels:
- Chính sách Khoa học và Công nghệ (Science and Technology Policy): Các phát hiện nhấn mạnh tầm quan trọng của việc tài trợ cho nghiên cứu liên ngành, đặc biệt là sự hội tụ của kỹ thuật và sinh học, để giải quyết các thách thức phức tạp trong sinh học. Chính phủ nên hỗ trợ các chương trình khuyến khích hợp tác giữa các ngành.
- Chính sách Sức khỏe Cộng đồng: Bằng cách cải thiện hiểu biết về cách các tế bào phản ứng với các yếu tố môi trường (ví dụ: độc tố, chất dinh dưỡng), có thể thông báo các chính sách liên quan đến an toàn thực phẩm, sức khỏe môi trường và các chiến lược can thiệp y tế dự phòng.
-
Societal benefits quantified where possible:
- Cải thiện sức khỏe con người: Bằng cách cho phép hiểu biết sâu sắc hơn về các bệnh liên quan đến rối loạn điều hòa gen và trao đổi chất, luận án này có thể góp phần vào việc phát triển các phương pháp điều trị hiệu quả hơn cho các bệnh như tiểu đường, ung thư hoặc các bệnh truyền nhiễm.
- An ninh lương thực: Ứng dụng trong nông nghiệp có thể dẫn đến việc tạo ra các loại cây trồng và vi sinh vật bền vững hơn, góp phần vào an ninh lương thực toàn cầu.
- Giảm thiểu ô nhiễm: Nền tảng này có thể được sử dụng để nghiên cứu phản ứng của vi sinh vật với các chất gây ô nhiễm, hỗ trợ phát triển các giải pháp xử lý sinh học (bioremediation) hiệu quả hơn.
-
International relevance với global implications: Nghiên cứu này có liên quan quốc tế sâu sắc vì các vấn đề về biến động môi trường và phản ứng của sinh vật là phổ biến trên toàn cầu.
- Tương tác với nghiên cứu quốc tế: Công trình này tương tác trực tiếp với các nghiên cứu quốc tế hàng đầu như của Acar và Van Oudenaarden (Hà Lan/Mỹ)[1] và Cookson et al. (Mỹ)[33], đóng góp vào kho tàng kiến thức toàn cầu về sinh học hệ thống.
- Áp dụng toàn cầu: Phương pháp luận và nền tảng công nghệ có thể được triển khai tại các phòng thí nghiệm trên khắp thế giới để giải quyết các câu hỏi sinh học cục bộ và toàn cầu, từ dịch tễ học bệnh truyền nhiễm đến các thách thức về môi trường.
- Đào tạo nhân tài: Việc phát triển các công cụ và phương pháp này tạo điều kiện thuận lợi cho việc đào tạo các thế hệ nhà khoa học tiếp theo với kỹ năng liên ngành, cần thiết để giải quyết các vấn đề sinh học phức tạp trên quy mô toàn cầu.
Đối tượng hưởng lợi
Luận án này mang lại lợi ích cho nhiều đối tượng khác nhau trong và ngoài giới học thuật.
-
Doctoral researchers: Các nghiên cứu sinh sẽ hưởng lợi từ luận án này bằng cách nhận diện các "khoảng trống nghiên cứu cụ thể" (specific research gaps) (tr. xviii, 4) liên quan đến việc định lượng phản ứng sinh học động. Luận án cung cấp một mô hình mạnh mẽ cho việc phát triển các nền tảng thực nghiệm liên ngành và các cách tiếp cận phương pháp luận nghiêm ngặt. Họ có thể sử dụng các "hướng nghiên cứu cụ thể" (concrete directions) (tr. 92) được đề xuất để định hình các dự án của riêng mình.
-
Senior academics: Các học giả cấp cao sẽ tìm thấy trong luận án này những "đóng góp lý thuyết" (theoretical advances) (tr. xviii) quan trọng cho các lĩnh vực như sinh học hệ thống, kỹ thuật sinh học và lý thuyết điều hòa gen. Các phát hiện về "lọc thông thấp thông tin" và "ghép nối mạnh mẽ" sẽ kích thích các cuộc tranh luận mới và định hình các khuôn khổ lý thuyết tiếp theo.
-
Industry R&D: Các chuyên gia R&D trong ngành công nghiệp dược phẩm, công nghệ sinh học và chẩn đoán sẽ hưởng lợi từ "các ứng dụng thực tế" (practical applications) (tr. 92) của nền tảng vi lỏng. Khả năng mô phỏng và kiểm soát môi trường vi mô động mở ra những con đường mới cho sàng lọc thuốc, tối ưu hóa quy trình sản xuất sinh học và phát triển các thiết bị chẩn đoán tiên tiến.
-
Policy makers: Các nhà hoạch định chính sách sẽ được cung cấp "các khuyến nghị dựa trên bằng chứng" (evidence-based recommendations) về tầm quan trọng của việc tài trợ cho nghiên cứu khoa học cơ bản và liên ngành. Các phát hiện của luận án nhấn mạnh giá trị của việc đầu tư vào các công nghệ đột phá để nâng cao hiểu biết về sức khỏe con người và môi trường.
-
Quantify benefits where possible:
- Giảm chi phí R&D: Việc sàng lọc thuốc hiệu quả hơn thông qua các nền tảng động lực học có thể giảm hàng triệu đô la chi phí phát triển thuốc bằng cách loại bỏ các ứng cử viên thuốc kém hiệu quả sớm hơn.
- Tăng tốc khám phá: Nền tảng vi lỏng có thể tăng tốc đáng kể tốc độ khám phá các cơ chế sinh học mới bằng cách cung cấp dữ liệu định lượng chính xác hơn và trong thời gian ngắn hơn so với các phương pháp truyền thống.
- Cải thiện độ chính xác chẩn đoán: Các thiết bị chẩn đoán dựa trên vi lỏng tiên tiến có thể cung cấp kết quả nhanh hơn và chính xác hơn, dẫn đến các quyết định điều trị tốt hơn.
Câu hỏi chuyên sâu
-
Theoretical contribution độc đáo nhất (name theory extended): Đóng góp lý thuyết độc đáo nhất là việc mở rộng Lý thuyết Điều hòa gen (Gene Regulation Theory) bằng cách mô tả con đường sử dụng galactose trong S. cerevisiae không chỉ là một công tắc di truyền mà còn là một bộ lọc thông tin thông thấp (low-pass information filter). Phát hiện này cung cấp một mô tả chức năng mới mang tính định lượng về cách tế bào xử lý các tín hiệu môi trường động. Luận án đã chỉ ra rằng động học của con đường này "dẫn đến việc lọc thông tin thông thấp" (tr. xviii) khi đối mặt với các nhiễu động dạng hình sin của nồng độ glucose, điều này làm thay đổi hiểu biết về chức năng của các mạng lưới sinh học từ một phản ứng nhị phân sang một quá trình xử lý tín hiệu tinh vi hơn.
-
Methodology innovation (compare với 2+ prior studies): Đổi mới phương pháp luận chính là việc phát triển và áp dụng một nền tảng vi lỏng tích hợp với phân tích đáp ứng tần số (frequency response analysis) sử dụng các nhiễu động dạng hình sin của nồng độ chất dinh dưỡng.
- So sánh với các nghiên cứu trước đây (ví dụ, Acar và Van Oudenaarden[1], 2005): Các nghiên cứu trước đó như của Acar và Van Oudenaarden đã khám phá "hiệu ứng bộ nhớ" của con đường galactose bằng cách sử dụng các thay đổi bước hoặc xung. Trong khi đó, luận án này "khác với công trình đã công bố trước đây ở chỗ nó sử dụng một chế độ nhiễu động thực sự động – các dạng sóng nồng độ glucose hình sin thuần túy thay vì các thay đổi bước hoặc xung đơn độc" (tr. 21). Phương pháp này mạnh mẽ hơn vì nó cho phép định lượng các đặc tính động lực học như tỷ lệ biên độ và độ lệch pha trên một phổ tần số, điều mà các đầu vào bước không thể làm được.
- So sánh với các kỹ thuật giám sát biểu hiện gen truyền thống (ví dụ, flow cytometry[57], microarrays[106]): Các kỹ thuật này bị chỉ trích là "chỉ là những bức ảnh tức thời về trạng thái biểu hiện tế bào" (tr. 5) và không có "độ phân giải thời gian đủ" để nắm bắt "các đặc tính thời gian xảy ra ở các thang thời gian nhanh hơn" (tr. 5). Nền tảng vi lỏng của luận án, kết hợp với phần mềm IMSQT độc quyền, cho phép "thu nhận dữ liệu biểu hiện gen phát triển theo thời gian với độ phân giải cao trong các tế bào đơn trong thời gian dài" (tr. xviii), cung cấp một bước nhảy vọt về khả năng phân tích động lực học thực sự.
-
Most surprising finding (với data support): Phát hiện đáng ngạc nhiên nhất là việc sự ghép nối giữa con đường sử dụng galactose và quá trình chuyển hóa glucose cung cấp một phản ứng mạnh mẽ trên toàn cầu (globally robust response), bất chấp sự suy giảm khả năng sử dụng galactose (tr. xviii). Điều này gây ngạc nhiên vì trực giác cho rằng một con đường chuyển hóa bị suy yếu sẽ dẫn đến hiệu suất tế bào kém.
- Bằng chứng dữ liệu: Dữ liệu hỗ trợ đến từ việc so sánh phản ứng của hai chủng S. cerevisiae, YPH499 và K699. Chủng YPH499 có "sự thiếu hụt trong GAL2, gen mã hóa cho bộ vận chuyển hexose đặc hiệu galactose" (tr. 25), dẫn đến "tăng gấp 10 lần lượng galactose cần thiết để cảm ứng tế bào YPH lên mức tương đương với K699" (tr. 23). Mặc dù có sự suy giảm đáng kể này, các thí nghiệm động lực học kết hợp với mô phỏng tính toán đã chứng minh rằng hệ thống vẫn duy trì khả năng thích nghi mạnh mẽ với các nhiễu động môi trường nhờ vào sự tương tác với con đường glucose.
-
Replication protocol provided? Mặc dù luận án không cung cấp một "giao thức nhân rộng" (replication protocol) theo một tài liệu độc lập, các chi tiết phương pháp luận được mô tả một cách tỉ mỉ trong các Chương 2 và 3, cùng với các phụ lục (Phụ lục A: MOCA, Phụ lục B: IMSQT, Phụ lục C: Nền tảng kính hiển vi tự động, Phụ lục D: Thiết bị vi lỏng, Phụ lục E: Mã tính toán cho T2uC). Các thông tin này bao gồm:
- "Giao thức biến đổi được ghi lại rõ ràng"[51] (tr. 27) cho các biến thể nấm men.
- Chi tiết về "thiết kế và chế tạo thiết bị vi lỏng" (Hình 1.5, Bảng D.1, D.3, D.5, D.7, tr. 18, 290-305).
- Mô tả về các "mã nguồn hoàn chỉnh" (complete source code) cho MOCA (Phụ lục A.5, tr. 109) và IMSQT (Phụ lục B.6-B.11, tr. 125-277).
- Các tham số cho nuôi cấy tế bào, tạo dạng sóng nồng độ và thu thập dữ liệu (tr. 29-30). Những chi tiết này đủ để một nhà nghiên cứu có kinh nghiệm trong lĩnh vực có thể tái tạo lại các thiết bị và thí nghiệm.
-
10-year research agenda outlined? Luận án không phác thảo một "lộ trình nghiên cứu 10 năm" (10-year research agenda) cụ thể với các mốc thời gian. Tuy nhiên, Chương 4, "Tóm tắt và Hướng đi Tương lai" (Summary and Future Directions), cung cấp "triển vọng và cái nhìn sâu sắc về các ứng dụng của nền tảng của tôi cho các hệ thống khác" (tr. 21) và "chương trình nghiên cứu trong tương lai với 4-5 hướng cụ thể" đã được đề cập trong phần Limitations and Future Research. Điều này bao gồm việc mở rộng sang các con đường điều hòa và loại tế bào khác, thăm dò các nhiễu động môi trường phức tạp hơn, tích hợp đa-omic, và cải thiện các công cụ phương pháp luận. Các hướng đi này cung cấp một nền tảng vững chắc cho một chương trình nghiên cứu kéo dài nhiều năm.
Kết luận
Luận án của Wyming Lee Pang đánh dấu một cột mốc quan trọng trong lĩnh vực sinh học định lượng, thiết lập một khuôn khổ mới để nghiên cứu động lực học biểu hiện gen trong điều kiện môi trường biến đổi. Những đóng góp cụ thể của nghiên cứu bao gồm:
- Phát triển nền tảng vi lỏng tiên tiến: Một hệ thống độc đáo cho phép "thu nhận dữ liệu biểu hiện gen phát triển theo thời gian với độ phân giải cao trong các tế bào đơn trong thời gian dài" (tr. xviii), tích hợp khả năng "tạo ra các dạng sóng nồng độ chính xác và liên tục" (tr. xviii).
- Khám phá lọc thông thấp thông tin: Lần đầu tiên chứng minh rằng con đường sử dụng galactose trong S. cerevisiae hoạt động như một "bộ lọc thông tin thông thấp" (low-pass information filtration) (tr. xviii), cung cấp cái nhìn định lượng mới về xử lý tín hiệu tế bào.
- Làm rõ tính mạnh mẽ hệ thống: Chỉ ra rằng "sự kết nối với quá trình chuyển hóa glucose cung cấp một phản ứng mạnh mẽ trên toàn cầu" (globally robust response) (tr. xviii), ngay cả khi con đường galactose bị suy yếu, nâng cao hiểu biết về kiến trúc mạng lưới sinh học.
- Ứng dụng phân tích đáp ứng tần số: Áp dụng thành công phân tích đáp ứng tần số từ kỹ thuật vào sinh học, cho phép "xác định các hiện tượng như cộng hưởng hệ thống... hoặc thậm chí xác định cấu trúc mạng lưới chưa được mô tả trước đây"[69] (tr. 4).
- Phát triển công cụ phần mềm: Tạo ra các tiện ích phần mềm độc quyền như MOCA và IMSQT, góp phần vào tính tái lập và hiệu quả của nghiên cứu vi lỏng.
Luận án này đã thúc đẩy mô hình sinh học hệ thống (systems biology paradigm) bằng cách cung cấp bằng chứng thực nghiệm và phương pháp luận cho việc xây dựng "các quy luật dự đoán cơ bản" (fundamental set of predictive laws) trong sinh học (tr. 2). Nó đã mở ra ít nhất ba luồng nghiên cứu mới: 1) thăm dò động lực học xử lý thông tin trong các mạng lưới sinh học khác, 2) phát triển các hệ thống vi lỏng tinh vi hơn để kiểm soát các yếu tố môi trường phức tạp và ngẫu nhiên, và 3) tích hợp sâu hơn các phương pháp thực nghiệm và tính toán để đạt được hiểu biết toàn diện về hành vi tế bào. Với sự tương tác với các nghiên cứu quốc tế hàng đầu như của Acar và Van Oudenaarden[1] và Cookson et al.[33], công trình này có tầm quan trọng toàn cầu, cung cấp các công cụ và khái niệm có thể được áp dụng rộng rãi để giải quyết các thách thức sinh học và y tế trên toàn thế giới, để lại một di sản về phương pháp luận nghiêm ngặt và khám phá định lượng trong sinh học.
Trích đoạn nội dung luận án
Tải xuống để đọc toàn bộUNIVERSITY OF CALIFORNIA, SAN DIEGO Quantitative analysis of genetic expression responses to dynamic microenvironmental perturbation A dissertation submitted in partial satisfaction of the requirements for the degree Doctor of Philosophy in Bioengineering by Wyming Lee Pang Committee in charge: Professor Jeff Hasty, Chair Professor Stuart Brody Professor David Gough Professor Alexander Hoffmann Professor Gabriel Silva 2007 UMI Number: 3245319 Copyright 2007 by Pang, Wyming Lee All rights reserved. INFORMATION TO USERS The quality of this reproduction is dependent upon the quality of the copy submitted. Broken or indistinct print, colored or poor quality illustrations and photographs, print bleed-through, substandard margins, and improper alignment can adversely affect reproduction. In the unlikely event that the author did not send a complete manuscript and there are missing pages, these will be noted.
Also, if unauthorized copyright material had to be removed, a note will indicate the deletion. ® UMI UMI Microform 3245319 Copyright 2007 by ProQuest Information and Learning Company. All rights reserved. This microform edition is protected against unauthorized copying under Title 17, United States Code.
ProQuest Information and Learning Company 300 North Zeeb Road P. Box 1346 Ann Arbor, MI 48106-1346 Copyright Wyming Lee Pang, 2007 All Rights Reserved The dissertation of Wyming Lee Pang is approved, and it is acceptable in quality and form for publication on microfilm. Chair University of California, San Diego 2007 ill For my wife Lisa Thanks for your patience 1V It is not the strongest of the species that survives, nor the most intelligent, but the one most responsive to change. Charles Robert Darwin (1809-1882) English Naturalist Table of Contents Signature Page 2.
oe V Table of Contents ằŠa da. T Ặä vì List of si “ốc ga aađa ẶỪẶỪỪD. ằAẼ a ix List of Tables 2. vàn xii Acknowledgments 2.
2 cà ki kg kg va xiii Curriculum Vite 2. A4 xvi Abstract 2 0 gà kg kg gà gà kg gà k v x k ng xviii 1 Introduction. g q g kg Tà gà và vàng 1 I5.3 Dynamic environments and living cells.4 Current techniques for monitoring gene expression .1 Modeling on-chip pressures and flows.3 Driving and controlling fluid flow. ee 21 2 Platform Development and Methodology.1 Cells, Constructs, and Culture Conditions .1 Parent and fluorescent variant strains .3 Steady-state expression characterization.
Confining microbial biofilms and microcolonies .3 A quantitative, long-duration imaging platform .4 Controllable dynamic microenvironments .3 Reduction of thermally induced drift in focal plane.5 Image processing and analysis. c Q Q Q Q HQ ng ng v kg và và 71 vì 3 Metabolic gene regulation in a dynamically changing environment .2 Materials and methods.1 Microfluidic device fabrication .2 Cell preparation and culture .3 Results and Discussion. ee ee ee 80 3.3 Computational and experimental analysis of response robustness. cà gà kg kg kg ky 88 3.
v k kg xa 88 4 Summary and Future Directions. ——— 92 A MOCA: Microfluidic Open Circuit Analyzer.1 Basic description, requirements, and concepts. gà kg vn 97 A.1 Channels in parallel .2 Channels in series 2. Q Q Q Q ng nu na và Là lv à va 101 A.
c c Q ng vn vn và Là là và va 101 A.4 MOCA models for devices used in this work. 2 vo 102 “` van ee 102 `9 “4.5_ Complete source code ÍOr moca. c c c r Q ng va 109 B IAISQT: IÀIage Segmentor, Quantifer, lTacker. cv ng gà k VN cv k k k VN va 120 B.5 Regions of [nteresE.
cv ng gà kg va 122 B.7 Saving and Loading IMSQT sessions. HQ nạ vn k k v kia 125 B.2 Xlanual segmentation using SEGBDIE.1 Tracking Validation with TRACKEDIT. Trajectory Viewing with TRACKVIEW .6 Complete source code for DISQT main window.7 Complete source code for SEGEDIT .8 Complete source code for TRACKEDIT .9 Complete source code for TRACKVIEW.10 Complete source code for segmentor modules .11 Complete source code for library functions. 00 00 2 ee k kg kia 277 C.1 Automated microscopy platform.
cv nu kg KV 277 C.2 Generalized light paths .2 Waveform generation platform 2. eee ee 282 D Microfluidic Devices 2. Q Q Q LH ng ng kg kg kg kg KV k kg 290 D.1 TC: Tesla miero-Chemosflat. uc cu cu Q .Ặ(ẼẰ CC aaaa.2 Device Schematic and Port Âssignments.2 T2uC: Temporal Tesla micro-Chemostat.
cu kg ki Và V V g V V Và 292 D.22_ Device Schematic and Port Àssignments.3 Glial Network Stimulator. Quy vẻ vn 303 D. cu kg Vy V V g V V Và 303 D.2 Device Schematic and Port Âssignments.4 DynaGrad: Dynamic Chemical Gradient Device. ng ng k kg k k k k Nà 305 D.2 Device Schematic and Port Assignments.
305 E Computational code for T?C data simulations and analysis. Model simulation code. 329 vill List of Figures Figure 1.1 Cartoon diagram of the galactose utilization pathway .2 Node/Segment schematie of a fuidie “t”-junetion.3 Node/Segment schematic of a fluidic cross-junction .4 Node/Segment schematic of a fluidic h-cross .5 Microfuidic device fabricatlon DFOC@SS. uc cv cv ru el 18 Figure 2.1 GAL2 expression in S.
cerevisiae YPH499, YPH500, and K699.2 Yeast transformation using pKT derived fluorescent fusion protein vectors.3 Steady-state galactose induction for S. cerevisiae YPH499 and K699 30 Figure 2.4 Steady-state glucose repression for S. cerevisiae YPH499 and K699 .5 Schematic diagram of the “Sticky-Pad” device.6 Patterning of “Sticky-Pads®, 2.7 Cellular growth on “Sticky-Pads” 2. ee ee ee 40 Figure 2.8 Colony comets on a “Sticky-Pad” 2.9 The XLC growth chamber array, 2.11 TuwCadvection/diffusion analysis schematic .12 1D representation oŸ the 'ÏuC with difusive and advective transport 47 Eigure 2.13 Comparison of model and experimental ˆ[C large molecule transport ol Eigure 2.14 Analytical of time evolved 1D concentration profiles under various advective velocities Ặ HH ÊäšẶỪ.15 Comparison of model and experimental TC small molecule transport .16 Nutrient transport in a fully confluent TwC microchamber .17 Advantages of monolayer imaging.
eee ee ees 55 Figure 2.18 A dynamically controlled gradient profile device .19 The T?uC oe 58 Figure 2.20 Cartoon depiction of laminar interface guidance .21 Linearly graded mixing output .22 Characterization of on-chip waveform generation .23 Nutrient transport in a confluent T?wC growth chamber.24 Loading of the T?uC. Quy ky àa 64 Figure 2.25 Autofocus pattern using dry air chambers and fluorescent illumination.1 Simulated and experimental expression trajectories in response to sinusoidal perturbation at varying frequencies.2 Schematic of coupled galactose and glucose regulatory networks used to derive the computational model.3 Induction/repression dynamic response of S. cerevisiae YPH499 and K699 86 Figure 3.4 Amplitude ratio and phase shift profiles from experimental and simulated 610 TT.I Node/Segment schematic of a fluidic h-cross .2 Graphical output of a MOCA simulation of an h-cross microfluidic system. The tooltip is displayed when hovering the mouse pointer over the node label.
Similar tooltips are available for the segment labels.3 Graphical results for MOCA simulation of the TuwC microfluidic device 103 Figure A.4 Graphical results for MOCA simulation of the T?C microfluidic device 105 Figure B.1 The IMSQT main window .2 Regions of interest definition panel in the DISQT main window.3 Channels definition panel in the MISQT main window.4 Segmentation panel in IMSQT main window .5 SEGEDIT manual segmentation editor.6 SEGEDIT subpanels: (a) morphological operations panel, (b) object editing, and (c) morphological filtering, 2. ee va 130 Figure B.7 Object quantification panel in IMSQT main window .8 Object tracking panel in IMSQT main window .9 TRACKEDIT object tracking validation viewer .10A sample of TRACKEDIT object display.11The TRACKEDIT display control panel.12Default graphical output using TRACKVIEW.13Data smoothing using TRACKVIEW.1 Imaging optical train and light paths .2 Waveform generation svstem configuration .1 Device schematic for TwC. Inset displays a magnified view of the growth chamber, 2.2 Device schematic for T?C. Insets display magnified views of the growth chamber and on-chip media switch.3 Device schematic for glial network stimulation device.
Insets display mag- nified views of the growth chamber and on-chip media switch.4 Device schematic for dynamic gradient device. Inset displays magnified views of the on-chip media switch. 305 Xi List of Tables Table 2.1 Yeast parent strains 2.2 Excitation and emission spectral maxima of fluorescent proteins. kg kg kg KT V va 25 Table B.1 A sample trajectory link table.
Q ky và y vàna 142 Table D.1 Master mold feature height specifications. ‘Photoresists are SU-8 unless otherwise specified. *These layers were patterned additively (e. no development step between this and the prior layer).
ch va 290 Table D.2 Port assignments for TC.3 Master mold feature height specifications. ‘Photoresists are SU-8 unless otherwise specified. *These layers were patterned additively (e. no development step between this and the prior layer) 2.4 Port assignments for T7uC.
Q Q Q ng va 293 Table D.5 Master mold feature height specifications. ‘Photoresists are SU-8 unless otherwise specified.6 Port assignments for the glial network stimulation device.7 Master mold feature height specifications. ‘Photoresists are SU-8 unless otherwise specified. * Bacterial and yeast devices require patterning the gradient outflow channel with adhesion molecules such as polylysine (bacterial) or Conavalin- A (yeast), gà ngà gà gà và v g k k k xxx va 305 Table D.8 Port assignments for the dynamic gradient device.
305 Xl Acknowledgments It’s been a long six years and I’ve been fortunate to have met so many interesting people and had more than my fair share of unique and great experiences. I’m not going to say that the journey was easy, and I’m sure that no one in their right mind would have guaranteed that. In fact, some of the most difficult times I’ve had to date were during my graduate career. These are moments spent wondering if the sum of who you already are and who you want to be is worth the next step in the plans you’ve made for yourself.
It’s cliché I know, but I couldn’t have made it here with out the unrelenting support of my colleagues, friends, and family. First, I owe immense gratitude to my professional colleagues, without whom this work would not have been possible. Hasty for providing financial support and valuable research advice throughout my doctoral studies, and having the patience to see everything through. In addition, I’m fortunate to have been a part of the integrative, collab- orative, and supportive environment provided by the members of the Systems Biodynamics Lab, and likewise, I am indebted to Jesse, Chris, Mike, and Ben who helped me edit and refine this dissertation.
Jennifer and Natalie, your skills at the bench are as good as your scientific savvy, and I'll be forever thankful for all your assistance with getting my yeast variants made. Matt and Dmitri, you guys work in numbers, theory, and code like artists in fine oils, and are the best computational model builders I know. Moreover, I would also xiii like to thank Dr. Schmid-Schoenbein, who has always been both kind and supportive, and the first of many bioengineering faculty to get me truly excited in research and the hunt for scientific answers.
Lastly, I would like to thank Dr. Groisman, even though our relation- ship wasn’t the best, he gave me a solid, and reliable foundation in microfluidic design and fabrication, for which I am sincerely grateful. More than anything I'd like to thank my friends who were always there to rejoice in the successes and help through the unavoidable setbacks be they professional or personal. Jennifer, Chris, Lauren, and Jessica, you were always available at a moments notice for coffee, be it at CUPs for a short break, Mandeville for a walk and a talk, the “triple-S” for a quick snack, or Expresso happy hour at the Grove.
There’s no need to explain how these moments have helped keep me sane (as well as thoroughly awake).
Nội dung được bảo vệ bản quyền — Tải xuống đầy đủ
Trích dẫn luận án này
Wyming Lee Pang (2007). Luận án tiến sĩ: Quantitative analysis of genetic expression responses to dynamic microenvironmental perturbation [Luận án tiến sĩ, University of California, San Diego]. LuanAn.net. https://luanan.net/khoa-hoc-giao-duc/luan-an-tien-si-quantitative-analysis-of-genetic-expression-responses-to-dynamic-microenvironmental-perturbation
Từ khóa và chủ đề nghiên cứu
Từ khóa liên quan
Xem thêm luận án cùng lĩnh vực
Chủ đề nghiên cứu
Câu hỏi thường gặp
Luận án "Luận án tiến sĩ: Quantitative analysis of genetic expression responses to dynamic microenvironmental perturbation" nghiên cứu về vấn đề gì?
Nghiên cứu tiến sĩ phân tích định lượng biểu hiện gen khi phản ứng với biến động môi trường vi mô. Làm sáng tỏ cơ chế điều hòa sinh học quan trọng.
Luận án "Luận án tiến sĩ: Quantitative analysis of genetic expression responses to dynamic microenvironmental perturbation" được bảo vệ tại trường nào?
Luận án này được bảo vệ tại University of California, San Diego. Năm bảo vệ: 2007.
Luận án "Luận án tiến sĩ: Quantitative analysis of genetic expression responses to dynamic microenvironmental perturbation" thuộc chuyên ngành gì?
Luận án "Luận án tiến sĩ: Quantitative analysis of genetic expression responses to dynamic microenvironmental perturbation" thuộc chuyên ngành Bioengineering. Danh mục: Khoa Học Giáo Dục.
Luận án "Luận án tiến sĩ: Quantitative analysis of genetic expression responses to dynamic microenvironmental perturbation" có bao nhiêu trang?
Luận án "Luận án tiến sĩ: Quantitative analysis of genetic expression responses to dynamic microenvironmental perturbation" có 357 trang. Bạn có thể xem trước một phần tài liệu ngay trên trang web trước khi tải về.
Cách tải luận án "Luận án tiến sĩ: Quantitative analysis of genetic expression responses to dynamic microenvironmental perturbation" về máy như thế nào?
Để tải luận án về máy, bạn nhấn nút "Tải xuống ngay" trên trang này, sau đó hoàn tất thanh toán phí lưu trữ. File sẽ được tải xuống ngay sau khi thanh toán thành công. Hỗ trợ qua Zalo: 0559 297 239.