Luận án tiến sĩ: Tích hợp khoa học khí hậu vào chính sách nước tại lưu vực sông Vu Gia-Thu Bon - Nghiên cứu của Tra Van Tran tại TU Dortmund
Dịch vụ thảo luận và phản biện luận văn, giúp cải thiện nội dung, phát hiện lỗ hổng logic, tăng giá trị học thuật trước khi nộp.
TU Dortmund University
Spatial Planning
Luan An
Doctorate Dissertation
Năm xuất bản
Số trang
165
Thời gian đọc
25 phút
Lượt xem
0
Lượt tải
0
Phí lưu trữ
50 Point
Tổng quan nhanh
- Chủ đề:
- 1. Tích hợp khoa học khí hậu vào chính sách nước hiệu quả
- Số trang:
- 165 trang
- Trường:
- TU Dortmund University
- Chuyên ngành:
- Spatial Planning
- Tác giả:
- Tra Van Tran
- Năm:
- 2018
Tóm tắt nội dung luận án
I. Tích hợp khoa học khí hậu vào chính sách nước hiệu quả
Tài liệu này tập trung vào việc tích hợp khoa học khí hậu vào các chính sách quản lý tài nguyên nước. Mục tiêu là nâng cao khả năng thích ứng với biến đổi khí hậu tại lưu vực sông Vu Gia-Thu Bon. Khu vực miền Trung Việt Nam này đang đối mặt với tình trạng thiếu nước nghiêm trọng. Biến đổi khí hậu dự kiến sẽ làm trầm trọng thêm vấn đề này. Việc áp dụng các phương pháp tiên tiến giúp xây dựng chính sách hiệu quả hơn. Các quyết định về kế hoạch nước cần dựa trên dữ liệu khoa học chính xác. Điều này đảm bảo tính bền vững và an ninh nguồn nước trong tương lai.
1.1. Bối cảnh cấp bách tại lưu vực sông Vu Gia Thu Bon
Lưu vực sông Vu Gia-Thu Bon, nằm ở duyên hải miền Trung Việt Nam, đang đối mặt với tình trạng khan hiếm nước. Vấn đề này dự kiến sẽ trở nên trầm trọng hơn do tác động biến đổi khí hậu. Sự cần thiết của việc quản lý tài nguyên nước hiệu quả là rất cao. Cần có các giải pháp thích ứng biến đổi khí hậu để bảo vệ nguồn nước.
1.2. Hạn chế của phương pháp truyền thống trong chính sách
Các nỗ lực trước đây giải quyết tình trạng thiếu nước thường theo hướng tiếp cận từ trên xuống. Phương pháp này dự đoán và sau đó hành động. Các đầu ra từ mô hình khí hậu toàn cầu (GCMs) được sử dụng. Tuy nhiên, sự không chắc chắn liên quan đến các mô hình khí hậu này làm giảm hiệu quả. Phương pháp này không cung cấp thông tin đầy đủ cho các biện pháp thích ứng, gây khó khăn cho việc xây dựng chính sách thích ứng.
II. Thích ứng biến đổi khí hậu cho lưu vực sông Vu Gia Thu Bon
Nghiên cứu này đề xuất một phương pháp mới để thích ứng biến đổi khí hậu. Nó kết hợp cả cách tiếp cận từ trên xuống và từ dưới lên trong đánh giá tác động biến đổi khí hậu. Phương pháp này khắc phục những hạn chế của các cách tiếp cận truyền thống. Nó cung cấp cái nhìn toàn diện hơn về hệ thống nước. Các nhà hoạch định chính sách có thể đưa ra quyết định dựa trên thông tin đáng tin cậy. Mục tiêu là phát triển các chính sách thích ứng bền vững. Các chính sách này nhằm đảm bảo quản lý tài nguyên nước hiệu quả, đối phó với những thách thức từ biến đổi khí hậu.
2.1. Nhu cầu thích ứng mới trước biến đổi khí hậu
Tác động biến đổi khí hậu đòi hỏi các chiến lược thích ứng mới. Vấn đề thiếu nước tại lưu vực sông Vu Gia-Thu Bon cần giải pháp toàn diện. Chính sách thích ứng phải dựa trên khoa học khí hậu vững chắc. Việc này nhằm giảm thiểu rủi ro và tăng cường an ninh nguồn nước. Cần có kế hoạch nước linh hoạt và chủ động.
2.2. Tiếp cận kết hợp top down và bottom up
Nghiên cứu sử dụng đánh giá tác động biến đổi khí hậu kết hợp. Đây là sự kết hợp giữa phương pháp từ trên xuống và từ dưới lên. Cách tiếp cận này giúp cải thiện độ tin cậy của thông tin. Nó hỗ trợ xây dựng các biện pháp thích ứng biến đổi khí hậu. Điều này giúp định hình các kế hoạch nước và quản lý tài nguyên nước hiệu quả hơn.
III. Phương pháp đánh giá tác động biến đổi khí hậu tiên tiến
Nghiên cứu áp dụng một phương pháp đánh giá tác động biến đổi khí hậu tiên tiến. Nó sử dụng mô hình cân bằng nước MIKE BASIN để phân tích phản ứng của hệ thống nước. Các điều kiện khó khăn được xác định dựa trên các phạm vi lượng mưa và nhiệt độ khác nhau. Sau đó, đầu ra từ 25 mô hình khí hậu toàn cầu (GCMs) được sử dụng. Các dữ liệu này giúp lập bản đồ không gian dễ bị tổn thương của hệ thống nước. Phương pháp này cung cấp cái nhìn sâu sắc về tác động biến đổi khí hậu. Nó hỗ trợ xây dựng các chính sách thích ứng dựa trên bằng chứng khoa học.
3.1. Ứng dụng mô hình MIKE BASIN đánh giá hệ thống nước
Một mô hình cân bằng nước MIKE BASIN được sử dụng. Mô hình này phân tích phản ứng của hệ thống nước. Việc này được thực hiện dưới các phạm vi lượng mưa và nhiệt độ khác nhau. Các điều kiện có vấn đề sau đó được xác định. Điều này cung cấp nền tảng cho việc hiểu rõ hơn về tính dễ bị tổn thương của lưu vực sông.
3.2. Khai thác dữ liệu từ các mô hình khí hậu toàn cầu GCMs
Đầu ra từ 25 mô hình khí hậu toàn cầu (GCMs) được sử dụng. Chúng giúp lập bản đồ không gian dễ bị tổn thương của hệ thống nước. Bản đồ này thể hiện các điều kiện khí hậu tương lai có thể xảy ra. Sự kết hợp này hỗ trợ phân tích chi tiết về tác động biến đổi khí hậu. Nó cung cấp thông tin quan trọng cho dự báo khí hậu và kế hoạch nước.
IV. Phân tích quản lý tài nguyên nước và dự báo khí hậu
Nghiên cứu tiến hành phân tích chi tiết hệ thống nước. Điều này được thực hiện dựa trên các điều kiện khó khăn đã được xác định. Các điều kiện này được gợi ý bởi cả mô hình MIKE BASIN và đầu ra của GCMs. Phân tích này là một bước quan trọng để hiểu sâu hơn về quản lý tài nguyên nước. Nó giúp xác định các khu vực cần ưu tiên hành động. Mục tiêu là tích hợp dự báo khí hậu vào quá trình lập kế hoạch nước. Điều này giúp nâng cao hiệu quả của các chính sách thích ứng. Nó đảm bảo các biện pháp được đề xuất phù hợp với thực tế khí hậu.
4.1. Xác định điều kiện khó khăn cho quản lý nước
Mô hình MIKE BASIN và các GCMs xác định các điều kiện gây vấn đề. Các điều kiện này có tác động trực tiếp đến quản lý tài nguyên nước. Việc xác định sớm giúp xây dựng các chiến lược thích ứng hiệu quả. Nó hỗ trợ việc lập kế hoạch nước trong bối cảnh tác động biến đổi khí hậu.
4.2. Tích hợp dự báo khí hậu để lập kế hoạch nước
Phân tích chi tiết hơn về hệ thống được thực hiện. Phân tích này tập trung vào các điều kiện khó khăn. Những điều kiện này được đề xuất bởi cả mô hình MIKE BASIN và đầu ra GCMs. Điều này cung cấp cơ sở vững chắc cho kế hoạch nước và thích ứng biến đổi khí hậu. Nó nâng cao độ chính xác của dự báo khí hậu trong việc ra quyết định.
V. Chiến lược quản lý tổng hợp lưu vực sông bền vững
Nghiên cứu này đóng góp vào việc phát triển chiến lược quản lý tổng hợp lưu vực sông bền vững. Nó cung cấp bằng chứng khoa học cho việc xây dựng chính sách thích ứng. Các chính sách này nhằm giảm thiểu rủi ro từ biến đổi khí hậu. Mục tiêu là tăng cường khả năng chống chịu của hệ thống nước và cộng đồng. Việc này bao gồm các biện pháp bảo tồn và quản lý nhu cầu. Sự hợp tác liên ngành là cần thiết để thực hiện các chiến lược này. Quản lý tổng hợp lưu vực sông sẽ đảm bảo an ninh nguồn nước lâu dài. Điều này tạo ra một khung pháp lý vững chắc cho tương lai.
5.1. Xây dựng chính sách thích ứng dựa trên bằng chứng khoa học
Kết quả nghiên cứu cung cấp bằng chứng khoa học đáng tin cậy. Bằng chứng này hỗ trợ xây dựng chính sách thích ứng hiệu quả. Chính sách cần tập trung vào quản lý tài nguyên nước bền vững. Nó cũng cần giảm thiểu tác động biến đổi khí hậu. Mục tiêu là bảo vệ lưu vực sông và cộng đồng.
5.2. Tăng cường khả năng chống chịu của hệ thống nước
Nghiên cứu giúp hiểu rõ hơn về tính dễ bị tổn thương của hệ thống. Từ đó, các biện pháp tăng cường khả năng chống chịu được đề xuất. Các biện pháp này bao gồm đầu tư hạ tầng và sáng kiến bảo tồn. Mục tiêu là đảm bảo an ninh nguồn nước trong bối cảnh biến đổi khí hậu. Quản lý tổng hợp lưu vực sông là yếu tố then chốt.
VI. Xây dựng kế hoạch nước phù hợp với mô hình khí hậu
Nghiên cứu vượt qua thách thức về sự không chắc chắn của mô hình khí hậu. Nó cung cấp thông tin hữu ích cho việc xây dựng kế hoạch nước. Các chính sách thích ứng có thể được thiết kế linh hoạt hơn. Điều này giúp định hướng cho nghiên cứu và phát triển chính sách tương lai. Việc tích hợp sâu hơn khoa học khí hậu vào quy trình hoạch định là cần thiết. Sự cải tiến liên tục của các mô hình khí hậu và công cụ phân tích sẽ nâng cao hiệu quả. Kế hoạch nước cần luôn được điều chỉnh để phù hợp với những thay đổi của khí hậu, đảm bảo tính hiệu quả và bền vững lâu dài.
6.1. Vượt qua thách thức từ sự không chắc chắn của mô hình
Phương pháp kết hợp giúp vượt qua hạn chế của GCMs. Mặc dù có sự không chắc chắn, nghiên cứu cung cấp thông tin hữu ích. Thông tin này giúp đưa ra các quyết định thích ứng. Nó hỗ trợ xây dựng kế hoạch nước linh hoạt hơn. Dự báo khí hậu được sử dụng một cách thận trọng và hiệu quả.
6.2. Định hướng cho nghiên cứu và phát triển chính sách tương lai
Nghiên cứu này đặt nền tảng cho các nỗ lực trong tương lai. Nó thúc đẩy việc tích hợp sâu hơn khoa học khí hậu vào chính sách. Các mô hình khí hậu và công cụ phân tích sẽ tiếp tục được cải thiện. Điều này giúp phát triển các chính sách thích ứng hiệu quả hơn nữa. Kế hoạch nước sẽ ngày càng chính xác và phù hợp hơn.
Mục lục chi tiết luận án
Tải xuống file đầy đủ để xem toàn bộ nội dung
Tải đầy đủ (165 trang)Nội dung chính
Tổng quan về luận án
Nghiên cứu của Tiến sĩ Kỹ thuật Tra Van Tran (Đại học Kỹ thuật Dortmund - TU Dortmund University, Cộng hòa Liên bang Đức, bảo vệ năm 2018 dưới sự hướng dẫn của Giáo sư Nguyễn Xuân Thịnh và Giáo sư Stefan Greiving) mang tính tiên phong trong việc giải quyết điểm nghẽn chuyển giao tri thức khí hậu vào quản trị tài nguyên nước. Luận án mang tiêu đề "Translating Climate Science into Policy Making in the Water Sector for the Vu Gia- Thu Bon River Basin" giải quyết trực tiếp một khoảng trống nghiên cứu (research gap) cốt lõi: sự đứt gãy giữa các mô hình khí hậu toàn cầu có độ bất định cao với quy trình hoạch định chính sách thích ứng cục bộ.
Theo Carter và Mäkinen (2011) cũng như Dilling và Lemos (2011), các cách tiếp cận truyền thống "dự báo rồi hành động" (predict-then-act) từ trên xuống (top-down) áp dụng mô hình hoàn lưu chung (General Circulation Models - GCMs) và hạ quy mô động lực/thống kê (downscaling) thường tạo ra những dự báo mang sai số tích lũy lớn, khiến các nhà hoạch định chính sách lúng túng trước các kịch bản mâu thuẫn (Brown, 2011; Stéphane Hallegatte et al., 2012).
Luận án thiết lập 5 câu hỏi nghiên cứu cụ thể:
- Thực trạng thiếu hụt nguồn nước tại lưu vực sông Vu Gia - Thu Bồn (VGTB) hiện nay diễn ra như thế nào?
- Biến đổi khí hậu (BĐKH) tác động ra sao đến lượng mưa và nhiệt độ tại lưu vực?
- Tình trạng thiếu nước sẽ biến chuyển như thế nào trong tương lai dưới các biên độ BĐKH khác nhau?
- Chính sách sử dụng đất hiện hành tác động như thế nào đến nhu cầu tiêu thụ nước?
- Những chính sách và lộ trình thích ứng khả thi nào cần được ban hành cho lưu vực VGTB?
Khung lý thuyết của nghiên cứu kết hợp lý thuyết bất định sâu (Deep Uncertainty Framework), tiếp cận co giãn quyết định (Decision Scaling Framework của Brown et al., 2012) và khung kịch bản trung tính (Scenario-Neutral Framework của Prudhomme et al., 2010). Phạm vi không gian nghiên cứu bao quát toàn bộ lưu vực VGTB với diện tích $10.350\text{ km}^2$ (trọng tâm là địa bàn tỉnh Quảng Nam và TP. Đà Nẵng), sử dụng chuỗi dữ liệu thủy văn - khí tượng lịch sử, 25 mô hình GCMs thuộc dự án CMIP5, và tư liệu viễn thám Landsat/SPOT giai đoạn 2011–2016 trong kỳ quy hoạch sử dụng đất 2011–2020. Tác động định lượng cốt lõi chỉ ra rằng có từ $66{,}36\text{ km}^2$ đến $87{,}77\text{ km}^2$ diện tích đất nông nghiệp sẽ đối mặt với rủi ro thiếu nước nghiêm trọng, dẫn đến mức thâm hụt tổng cộng từ 11 triệu đến 21 triệu $\text{m}^3$ nước tưới.
Literature Review và Positioning
Tổng quan y văn quốc tế ghi nhận hai dòng tiếp cận chính trong đánh giá tác động BĐKH đối với tài nguyên nước:
Dòng tiếp cận Top-down (Từ trên xuống): Được định hình từ hội nghị COP-1 UNFCCC năm 1995 (Carter và Mäkinen, 2011; Dessai và Hulme, 2004), chu trình bắt đầu từ kịch bản phát thải khí nhà kính (GHG), chạy qua các mô hình GCMs với độ phân giải thô ($250\text{ km} - 600\text{ km}$), sau đó hạ quy mô động lực thông qua Regional Climate Models (RCMs) như trong nghiên cứu của Maraun et al. (2010), Xue et al. (2014) hoặc hạ quy mô thống kê (Tofiq và Guven, 2014; Yonggang et al., 2013; Chen et al., 2012). Nhược điểm chí mạng là chuỗi tích lũy bất định (cascade of uncertainties) khiến kết quả dự báo ở cấp lưu vực phân kỳ quá lớn.
Dòng tiếp cận Bottom-up (Từ dưới lên): Khởi xướng nhằm tập trung vào tính dễ bị tổn thương (vulnerability domain) của hệ thống tiếp nhận (Dessai và Hulme, 2004; García, 2014). Dựa trên lý thuyết đánh giá rủi ro của Plate (2002): $$R(x) = \int_0^\infty C(x)f(x),dx$$ trong đó $C(x)$ là hàm hậu quả và $f(x)$ là hàm mật độ xác suất của biến cố khí hậu. Hallegatte et al. (2012) và Brown et al. (2012) lập luận rằng trong điều kiện BĐKH, việc cố gắng ước lượng chính xác $f(x)$ là bất khả thi; do đó, phương pháp bottom-up tập trung khảo sát đáp ứng hệ thống $C(x)$ trước toàn bộ dải biến thiên của biến số $x$.
Các nỗ lực tích hợp gần đây bao gồm:
- Khung Scenario-Neutral của Prudhomme et al. (2010): Tách biệt độ nhạy cảm của lưu vực ra khỏi các kịch bản khí hậu toàn cầu.
- Tiếp cận thích ứng bền vững (Robust Adaptation) của Wilby và Dessai (2010): Sàng lọc các giải pháp ít hối tiếc (low-regret) kết hợp biên an toàn sinh thái.
- Mô hình WEAP tích hợp tham vấn đa bên của Bhave et al. (2014) tại Ấn Độ: Kết hợp 4 mô hình RCMs với phân tích đa tiêu chí (MCA).
- Khung Future Visioning của Shaw et al. (2009) và Sheppard et al. (2011): Trực quan hóa kịch bản khí hậu tại địa phương để xây dựng đồng thuận xã hội.
Luận án định vị tại điểm giao thoa của Decision Scaling (Brown et al., 2012). Thay vì hạ quy mô GCM phức tạp, nghiên cứu sử dụng mô hình MIKE BASIN quét toàn bộ không gian khí hậu (climate space) để tìm "ngưỡng dễ bị tổn thương" (vulnerability thresholds), sau đó ánh xạ trực tiếp kết quả của 25 mô hình GCMs lên không gian này.
So sánh với các nghiên cứu thủy văn quốc tế, mô hình thủy văn lumped/conceptual trong luận án khắc phục nhược điểm thừa tham số (over-parameterization) của mô hình process-driven (Blöschl, 1995; Sivapalan, 2003) và vượt trội hơn cách tiếp cận thuần túy data-driven (Littlewood et al., 2003; Chiew, 2003). Kết quả mô phỏng thủy văn tương đương với các nghiên cứu điển hình sử dụng mô hình bán phân bố như HEC-HMS tại lưu vực Nepal (Kafle et al., 2010 - đạt đỉnh lũ $98%$), Jordan (Abushandi và Merkel, 2013) hay Uganda (Kaatz, 2014).
Đóng góp lý thuyết và khung phân tích
                   +-----------------------------------------------+
                   |              BOTTOM-UP DOMAIN                 |
                   |   MIKE BASIN & MIKE NAM Modeling Framework    |
                   |  (Parametric Stress-Testing: Temp & Rainfall) |
                   +-----------------------+-----------------------+
                                           |
                                           v
                   +-----------------------------------------------+
                   |     System Vulnerability Space & Thresholds   |
                   |   (Water Deficit: 11 - 21M m3; 66 - 88 km2)   |
                   +-----------------------+-----------------------+
                                           ^
                                           |  (Direct Mapping)
                   +-----------------------+-----------------------+
                   |               TOP-DOWN DOMAIN                 |
                   |       25 CMIP5 GCMs (RCP Scenarios)           |
                   |        (Omission of RCM Downscaling)          |
                   +-----------------------------------------------+
                                           |
                                           v
                   +-----------------------------------------------+
                   |   INTEGRATED POLICY & SPATIAL MASTER PLAN     |
                   |  - Demand Reduction: Water-saving, Crops      |
                   |  - Supply Augmentation: Reservoirs, Desal     |
                   +-----------------------------------------------+
Đóng góp cho lý thuyết
- Mở rộng lý thuyết Đánh giá Rủi ro BĐKH (Climate Risk Assessment Theory): Luận án chứng minh sự ưu việt của việc đảo ngược quy trình đánh giá truyền thống. Thay vì gánh chịu sai số tích lũy từ GCM $\rightarrow$ RCM $\rightarrow$ Hydrological Model $\rightarrow$ Impact $\rightarrow$ Policy, quy trình xác lập không gian tổn thương của lưu vực trước, loại bỏ hoàn toàn khâu trung gian hạ quy mô khí hậu phức tạp.
- Lý thuyết Cân bằng Động Năng lượng và Thủy văn (Hydro-climatic Feedback Theory): Nghiên cứu củng cố luận điểm của IPCC AR4/AR5 về cơ chế bức xạ cưỡng bức (Effective Radiative Forcing - ERF), phản hồi hơi nước và hiện tượng mất cân bằng cán cân nước mặt khi nhiệt độ mùa khô vượt $30^\circ\text{C}$, khiến bốc thoát hơi nước tiềm năng (PET) vượt xa lượng mưa tích lũy từ tháng 2 đến tháng 4.
- Khung chuyển giao khoa học - chính sách (Science-Policy Interface Framework): Khắc phục sự phân kỳ mục tiêu giữa "khoa học quy giản" (reductionist approach - tập trung vào bản chất chuỗi nhân quả) và "hoạch định chính sách" (planning approach - tập trung vào giải pháp tích hợp đa ngành).
Khung phân tích độc đáo
Khung phân tích tích hợp 4 cấu phần trụ cột:
- Xác lập ngưỡng khí hậu nguy hại (Climate Hazard and Threshold Identification): Ứng dụng chỉ số cấp nước mặt (Surface Water Supply Index - SWSI) lấy năm hạn hán lịch sử cực đoan 1998 làm mốc đối chuẩn (benchmark).
- Mô hình hóa hệ thống tài nguyên nước (System Modeling): Tích hợp mô hình dòng chảy mưa rào MIKE NAM vào hệ thống quản lý cân bằng nước lưu vực MIKE BASIN (kết hợp công nghệ GIS).
- Khám phá rủi ro và ánh xạ không gian tổn thương (Climate Risk Discovery & Mapping): Quét tham số nhiệt độ ($\Delta T$) và lượng mưa ($\Delta P$) theo lưới đa chiều, sau đó chiếu 25 tập dữ liệu GCMs từ CMIP5 lên lưới tổn thương để xác định xác suất đồng thuận (maximum consensus case).
- Tích hợp chính sách không gian và viễn thám (Spatial Policy & Remote Sensing Integration): Đánh giá chuyển đổi lớp phủ bề mặt (Land Cover/Land Use Change) giai đoạn 2011–2016 nhằm đo lường nhu cầu dùng nước thực tế phát sinh từ chính sách kinh tế - xã hội.
Phương pháp nghiên cứu tiên tiến
Thiết kế nghiên cứu
- Triết lý nghiên cứu: Thực chứng phản biện (Critical Realism) kết hợp thực dụng luận (Pragmatism), nhìn nhận BĐKH là một thực thể vật lý khách quan nhưng việc thích ứng đòi hỏi các giải pháp mô hình hóa có tính ứng dụng chính sách cao.
- Thiết kế đa tầng (Multi-level Design): Tích hợp quy mô vĩ mô (25 GCMs toàn cầu thuộc CMIP5), quy mô trung gian (toàn lưu vực VGTB $10.350\text{ km}^2$) và quy mô vi mô (các nút nhu cầu tưới tiêu cấp huyện/xã, tiêu biểu như Nông Sơn, Thạnh Mỹ, Đại Lộc, Điện Bàn).
Quy trình nghiên cứu rigorous
- Mô phỏng Thủy văn cục bộ:
- Thiết lập mô hình lumped conceptual MIKE NAM cho 2 tiểu lưu vực chính: Trạm Nông Sơn (lưu vực Thu Bồn) và Trạm Thạnh Mỹ (lưu vực Vu Gia).
- Kiểm định độ tin cậy bằng chỉ số Nash-Sutcliffe Efficiency (NSE) qua hai giai đoạn hiệu chỉnh (calibration) và kiểm thực (validation).
- Mô hình hóa Nhu cầu Nước đa ngành:
- Nhu cầu nước sinh hoạt và công nghiệp được tính toán chi tiết dựa trên Quy chuẩn Xây dựng Việt Nam (Bộ Xây dựng, 2006) kết hợp niên giám thống kê dân số, tốc độ tăng trưởng kinh tế tỉnh Quảng Nam và TP. Đà Nẵng.
- Nhu cầu nước tưới nông nghiệp được tính toán riêng biệt cho từng tiểu vùng thủy lợi, phân bổ theo mùa vụ (vụ Đông Xuân và Hè Thu), trong đó lúa nước chiếm tới 70% diện tích tưới.
- Phân tích Viễn thám và Biến động Lớp phủ (LULC):
- Sử dụng ảnh vệ tinh đa thời gian Landsat 8 (năm 2016) và đối chuẩn với ảnh vệ tinh độ phân giải cao SPOT 7 (cho khu vực Đà Nẵng).
- Thực hiện phân loại giám sát (Supervised Classification) kết hợp phương pháp dựa trên chỉ số (Index-based approach): Chỉ số Thực vật Biệt sai Chuẩn hóa (NDVI), Chỉ số Xây dựng Biệt sai Chuẩn hóa (NDBI) và Chỉ số Nước Biệt sai Chuẩn hóa (NDWI).
- Kiểm định độ chính xác bằng ma trận nhầm lẫn (Confusion Matrix), tính toán độ chính xác của người sản xuất (Producer's Accuracy), độ chính xác của người dùng (User's Accuracy) và hệ số Kappa dựa trên các điểm đối chứng mặt đất (Ground Reference Points).
Data và phân tích
- Dữ liệu khí tượng thủy văn: Chuỗi quan trắc lượng mưa, nhiệt độ, độ ẩm, tốc độ gió, bốc hơi và lưu lượng dòng chảy nhiều năm tại các trạm Nông Sơn, Thạnh Mỹ, Ái Nghĩa, Cẩm Lệ, Giao Thủy... cung cấp bởi Trung tâm Khí tượng Thủy văn Quốc gia (NHMS), Viện Khoa học Khí tượng Thủy văn và Biến đổi khí hậu (IMHEN).
- Dữ liệu viễn thám: Phân tích sự chuyển đổi từ đất nông nghiệp sang đất xây dựng, đất trống và thảm thực vật từ năm 2011 đến 2016, so sánh trực tiếp với số liệu quy hoạch sử dụng đất của Bộ Tài nguyên và Môi trường (MONRE).
- Công cụ phần mềm chuyên dụng: MIKE BASIN, MIKE NAM (Danish Hydraulic Institute - DHI), Climate Data Operators (CDO) để xử lý dữ liệu lưới NetCDF từ CMIP5, ArcGIS cho phân tích không gian và nội suy song tuyến tính (Bi-linear Interpolation).
Phát hiện đột phá và implications
Những phát hiện then chốt
"The results obtained in the study suggest that at a minimum, 66.36 km2 of agricultural area would be facing water challenges in the future. Under more severe climate change conditions, up to 87.77 km2 of crops would be facing water shortages. Overall, there is a water deficit of between approximately 11 million and 21 million m3 of water for agricultural production."
- Sự phân kỳ sâu sắc giữa mùa mưa và mùa khô: Lượng mưa tại lưu vực VGTB mang tính biến thiên không gian - thời gian cực đoan. Mùa mưa (tháng 9 – 12) chiếm tới xấp xỉ $70%$ tổng lượng mưa năm, trong khi 8 tháng mùa khô (tháng 1 – 8) chỉ đóng góp $30%$, riêng 3 tháng kiệt nhất chiếm chưa đầy $6%$. Từ tháng 2 đến tháng 4, nhiệt độ thường xuyên vượt ngưỡng $30^\circ\text{C}$ khiến bốc thoát hơi nước tiềm năng vượt lượng mưa thực tế.
- Định lượng diện tích và thể tích thâm hụt nước: Luận án xác định chính xác ở kịch bản BĐKH tối thiểu, có $66{,}36\text{ km}^2$ đất canh tác nông nghiệp rơi vào tình trạng thiếu nước. Khi BĐKH diễn biến khắc nghiệt hơn, diện tích chịu hạn tăng vọt lên $87{,}77\text{ km}^2$. Tổng dung tích nước thiếu hụt cho nông nghiệp dao động từ 11 triệu $\text{m}^3$ đến 21 triệu $\text{m}^3$.
- Xác định các nút thủy lợi xung yếu (Vulnerable Nodes): Mô hình MIKE BASIN nhận diện hàng loạt nút cấp nước có độ tin cậy cấp nước (Reliability) suy giảm nghiêm trọng trong mùa khô, bao gồm các nút:
IRR_VG07,IRR_VG09,IRR_VG12,IRR_VG13(thuộc hệ thống sông Vu Gia) vàIRR_TB09,IRR_TB13,IRR_TB15,IRR_TB21,IRR_VG23(thuộc hệ thống sông Thu Bồn). - Tác động kép của vận hành hồ chứa thủy điện thượng nguồn: Sự hiện diện của các hồ chứa thượng nguồn làm thay đổi căn bản phân phối dòng chảy kiệt. Nếu không có quy trình vận hành liên hồ chứa tối ưu hướng đến mục tiêu xả nước hạ du, rủi ro thiếu hụt nước tại vùng đồng bằng ven biển (Đại Lộc, Điện Bàn, Hội An, Đà Nẵng) sẽ bị khuếch đại gấp nhiều lần.
- Mâu thuẫn giữa quy hoạch sử dụng đất và áp lực nguồn nước: Phân tích viễn thám giai đoạn 2011–2016 chỉ ra sự chuyển đổi mạnh mẽ từ đất lúa nước sang đất đô thị/công nghiệp và đất trống quanh vùng ven Đà Nẵng - Quảng Nam. Mặc dù diện tích nông nghiệp có xu hướng thu hẹp nhẹ do đô thị hóa, nhu cầu nước cục bộ cho các vùng chuyên canh lúa còn lại vẫn tăng cao do tính dễ tổn thương trước xâm nhập mặn và suy giảm dòng chảy kiệt.
Implications đa chiều
- Đóng góp phương pháp luận (Methodological Advances): Chứng minh tính khả thi của việc kết hợp bottom-up stress-testing với tập hợp đa mô hình GCM (CMIP5 ensemble) mà không cần bước hạ quy mô thống kê/động lực tốn kém tài nguyên tính toán.
- Hàm ý thực tiễn và chính sách (Policy Pathways): Đề xuất hai nhóm giải pháp chiến lược đồng bộ:
- Nhóm giải pháp giảm nhu cầu / bảo tồn nước (Demand Management): Chuyển đổi cơ cấu cây trồng chịu hạn, thay đổi tập quán canh tác lúa nước (áp dụng kỹ thuật tưới ngập khô xen kẽ - AWD), ứng dụng công nghệ tưới tiết kiệm nước tại các nút xung yếu (
IRR_VG07,IRR_TB15). - Nhóm giải pháp gia tăng nguồn cung (Supply Augmentation): Nâng cấp dung tích hữu ích các hồ chứa hiện hữu, xây dựng bổ sung các công trình điều tiết nước liên lưu vực, và nghiên cứu giải pháp khử mặn nước biển (Seawater Desalination) cho các đô thị ven biển như Đà Nẵng và Hội An trong các đợt hạn cực đoan.
- Nhóm giải pháp giảm nhu cầu / bảo tồn nước (Demand Management): Chuyển đổi cơ cấu cây trồng chịu hạn, thay đổi tập quán canh tác lúa nước (áp dụng kỹ thuật tưới ngập khô xen kẽ - AWD), ứng dụng công nghệ tưới tiết kiệm nước tại các nút xung yếu (
Limitations và Future Research
- Độ phân giải không gian của dữ liệu khí hậu GCM: Việc sử dụng trực tiếp kết quả thô của 25 mô hình GCMs thông qua nội suy song tuyến (Bi-linear interpolation) giúp tránh sai số hạ quy mô nhưng làm giảm khả năng nắm bắt các đặc thù địa hình vi khí hậu phức tạp của dãy Trường Sơn.
- Giả định tĩnh về kinh tế - xã hội: Mô hình nhu cầu nước trong tương lai chủ yếu dựa trên xu hướng quy hoạch đất đai và quy chuẩn xây dựng hiện hành, chưa tích hợp đầy đủ các kịch bản phát triển kinh tế xã hội đa chiều (Shared Socioeconomic Pathways - SSPs).
- Mô phỏng thủy lực xâm nhập mặn: Mô hình MIKE BASIN tập trung vào cân bằng nước tổng thể cấp lưu vực (water balance) mà chưa tích hợp sâu mô hình thủy lực 1D/2D (như MIKE 11 / MIKE 21) để mô phỏng tương tác động giữa triều cường, xâm nhập mặn và dòng chảy kiệt tại các cửa sông Thu Bồn và Hàn.
- Hướng nghiên cứu tương lai:
- Tích hợp coupled hydro-economic modeling để đánh giá chi phí - lợi ích tài chính của từng giải pháp công trình (hồ chứa, khử mặn) so với phi công trình.
- Nâng cấp mô hình viễn thám sử dụng chuỗi ảnh Sentinel độ phân giải cao ($10\text{ m}$) và thuật toán học máy (Random Forest/SVM) để theo dõi thời gian thực biến động mùa vụ lúa.
Tác động và ảnh hưởng
- Tác động học thuật: Luận án cung cấp một nghiên cứu điển hình mẫu mực (benchmark case study) tại Đông Nam Á về ứng dụng khung phân tích Decision Scaling, mở ra hướng trích dẫn quan trọng cho các nghiên cứu thủy văn thích ứng BĐKH tại các lưu vực sông ven biển miền Trung Việt Nam.
- Ảnh hưởng chính sách cấp tỉnh và quốc gia: Kết quả nghiên cứu cung cấp luận cứ khoa học trực tiếp cho Sở Tài nguyên và Môi trường (DONRE), Sở Nông nghiệp và Phát triển Nông thôn (DARD) của tỉnh Quảng Nam và TP. Đà Nẵng trong việc rà soát Quy hoạch tài nguyên nước lưu vực sông VGTB đến năm 2030, tầm nhìn 2050 và hoàn thiện Quy trình vận hành liên hồ chứa trên lưu vực sông Vu Gia - Thu Bồn (Quyết định của Thủ tướng Chính phủ).
- Lợi ích kinh tế - xã hội: Giúp bảo vệ sinh kế cho hàng trăm ngàn hộ nông dân tại hạ lưu, giảm thiểu tổn thất kinh tế do hạn hán, ngăn ngừa nguy cơ thiếu nước sinh hoạt cho hơn 1 triệu dân tại đô thị loại 1 Đà Nẵng.
Đối tượng hưởng lợi
- Nghiên cứu sinh / Giới học thuật: Tiếp cận phương pháp luận tích hợp top-down & bottom-up hoàn chỉnh, nắm vững kỹ thuật ghép nối mô hình thủy văn MIKE với dữ liệu khí hậu CMIP5 và công nghệ viễn thám GIS.
- Cơ quan Quản lý Nhà nước (Bộ TN&MT, DONRE Quảng Nam & Đà Nẵng): Sở hữu bộ công cụ định lượng hỗ trợ ra quyết định phân bổ hạn ngạch khai thác nước và điều tiết hồ chứa trong các tháng hạn kiệt.
- Đơn vị Quản lý Thủy nông và Khai thác Thủy điện: Tối ưu hóa lịch xả nước phát điện kết hợp cấp nước tưới tiêu hạ du, giảm thiểu xung đột lợi ích giữa ngành điện và ngành nông nghiệp.
- Cộng đồng dân cư và nông dân lưu vực VGTB: Hưởng lợi từ sự ổn định nguồn nước sinh hoạt và sản xuất nông nghiệp trước các hiện tượng thời tiết cực đoan.
Câu hỏi chuyên sâu
1. Đóng góp lý thuyết độc đáo nhất của luận án là gì?
Luận án mở rộng lý thuyết Decision Scaling (Brown et al., 2012) bằng cách thiết lập ma trận tổn thương nước nông nghiệp đa biến ($\Delta P, \Delta T$) tại một lưu vực ven biển nhiệt đới gió mùa có độ dốc cao và mùa khô kéo dài. Thay vì dựa vào một kịch bản dự báo duy nhất, nghiên cứu xác lập không gian trạng thái chịu tải của lưu vực trước khi đối chiếu với các mô hình khí hậu.
2. Đổi mới phương pháp luận so với các nghiên cứu trước đây như thế nào?
So với các nghiên cứu truyền thống tại Việt Nam (sử dụng 1-2 mô hình RCM hạ quy mô), luận án sử dụng toàn bộ tập hợp 25 mô hình GCMs thuộc CMIP5 kết hợp công cụ CDO, loại bỏ hoàn toàn các giả định thiếu chắc chắn của hạ quy mô thống kê, đồng thời tích hợp trực tiếp ảnh viễn thám đa thời gian (Landsat 8 và SPOT 7) để kiểm chứng áp lực sử dụng đất.
3. Phát hiện bất ngờ nhất từ dữ liệu thực nghiệm là gì?
Mặc dù diện tích đất nông nghiệp có xu hướng chuyển đổi sang đất đô thị/công nghiệp trong kỳ quy hoạch 2011–2016, tổng nhu cầu nước tưới nông nghiệp tại các nút hạ lưu không hề suy giảm mà trái lại mức độ thâm hụt nước ngày càng gay gắt (đạt mức thiếu hụt lên đến 21 triệu $\text{m}^3$), do sự tập trung vào thâm canh lúa nước và sự gia tăng bốc thoát hơi nước vượt lượng mưa trong các tháng 2, 3 và 4.
4. Luận án có cung cấp quy trình tái lập (Replication Protocol) không?
Có. Toàn bộ quy trình từ thu thập số liệu trạm, tính toán chỉ số SWSI, thiết lập thông số mô hình MIKE NAM (hệ số dòng chảy, dung tích trữ đất), hiệu chỉnh chỉ số Nash-Sutcliffe, xây dựng mạng lưới nút MIKE BASIN, đến quy trình phân loại ảnh viễn thám có ma trận kiểm định sai số đều được mô tả chi tiết, cho phép tái lập trên các lưu vực sông tương đồng (như sông Hương, sông Ba).
5. Lộ trình nghiên cứu 10 năm tiếp theo được định hình ra sao?
Cần tập trung vào 3 trọng tâm: (1) Tích hợp mô hình dự báo thời tiết hạn mùa (Seasonal Forecasting) vào thời gian thực của MIKE BASIN; (2) Phát triển khung tối ưu hóa đa mục tiêu kết hợp trí tuệ nhân tạo (AI-driven multi-objective optimization) cho vận hành liên hồ chứa thủy điện; (3) Đánh giá chi tiết rủi ro xâm nhập mặn kết hợp mô hình kinh tế nước (Hydro-economic modeling).
Kết luận
- Luận án đã giải quyết xuất sắc bài toán chuyển giao tri thức khí hậu phức tạp thành công cụ hỗ trợ ra quyết định thực tế trong quản lý tài nguyên nước tại lưu vực sông Vu Gia - Thu Bồn.
- Thiết lập thành công mô hình tích hợp kết hợp giữa phương pháp tiếp cận từ dưới lên (Bottom-up MIKE BASIN) và dữ liệu tập hợp từ trên xuống (Top-down 25 GCMs CMIP5), chứng minh tính vượt trội so với cách tiếp cận dự báo truyền thống.
- Lượng hóa chính xác mức độ dễ bị tổn thương: diện tích canh tác chịu rủi ro thiếu nước từ $66{,}36\text{ km}^2$ đến $87{,}77\text{ km}^2$, tương ứng lượng nước thiếu hụt từ 11 đến 21 triệu $\text{m}^3$.
- Nhận diện chính xác các nút thủy lợi xung yếu (
IRR_VG07,IRR_TB15...) và đề xuất khung giải pháp thích ứng toàn diện bao gồm quản lý nhu cầu (nông nghiệp tiết kiệm nước) và bổ sung nguồn cung (điều tiết hồ chứa, khử mặn). - Mở ra các hướng nghiên cứu liên ngành đột phá về quy hoạch không gian thích ứng khí hậu, liên kết quản trị tài nguyên nước giữa các thực thể hành chính (Đà Nẵng - Quảng Nam), tạo di sản học thuật có giá trị lý luận và thực tiễn lâu dài cho ngành kỹ thuật không gian và quản trị tài nguyên nước.
Trích đoạn nội dung luận án
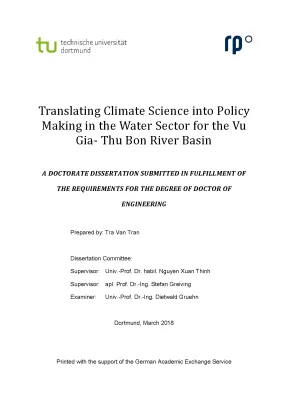
Tải xuống để đọc toàn bộTranslating Climate Science into Policy Making in the Water Sector for the Vu Gia- Thu Bon River Basin A DOCTORATE DISSERTATION SUBMITTED IN FULFILLMENT OF THE REQUIREMENTS FOR THE DEGREE OF DOCTOR OF ENGINEERING Prepared by: Tra Van Tran Dissertation Committee: Supervisor: Univ. Nguyen Xuan Thinh Supervisor: apl. Stefan Greiving Examiner: Univ. Dietwald Gruehn Dortmund, March 2018 Printed with the support of the German Academic Exchange Service ACKNOWLEDGEMENT With great pleasure, I would like to acknowledge the roles of several individuals and organizations who were instrumental to the completion of my Ph.
Without them, the research would have never seen the light of day. Firstly, I would like to express my sincere appreciation to my supervisor Prof. Nguyen Xuan Thinh, you have been a great mentor to me. I would like to thank you for supervising my research and your support during my entire research stay at RIM.
I am forever grateful. I further wish to express my deep sense of gratitude towards my second supervisor, Prof. I thank you for your valuable input towards my research and all the time and support you have given me for this research that made it possible. I am grateful towards Prof.
Dietwald Gruehn- Chairperson of the Ph. Committee at the Faculty of Spatial Planning, TU Dortmund University who accepted to be the chairperson for my exam committee. Your support during the submission of my thesis and your time during the oral examination made the publication of my results possible. My deepest appreciation belongs to my family including my father, my mother, and my sister for their support, patience, and understanding throughout the duration of my study.
I would like to further acknowledge Dr. Nguyen Xuan Hien- Director and Mr. Khuong Van Hai at the Center for Marine Hydro-Meterological Research and the research members at the Center for their valuable technical input and assistance. I am deeply grateful to Associate Prof.
Nguyen Van Thang- Director General, Associate Prof. Huynh Thi Lan Huong- Deputy Director General, Dr. Mai Van Khiem- Deputy Director General, Mr. Nguyen Van Dai, and Mr.
Ha Truong Minh, at the Viet Nam Institute of Meteorology, Hydrology and Climate Change for their supporting role in climate change General Circulation Models, and the development of the hydrological model package. I would like to recognize the important roles of Associate Prof. Tran Hong Thai- Deputy Director General of the Viet Nam National Hydro- Meteorological Services, i and Mr. Dinh Phung Bao- director of the Central Regional Hydro- Meteorological Center for authorizing the use of hydrological and meteorological data.
I am thankful for the support received from Mr. Luu Duc Dung, Secretary to the “National Scientific Program on Natural Resources, Environment and Climate Change” standing office, and Mr. Nguyen Ngoc Han at the Viet Nam Institute for Fishery and Economic Planning” for their supporting role in the remote sensing aspect in my research. I would also like to acknowledge the support I received from both staff members and fellow Ph.
students at RIM Department at the Faculty of Spatial Planning, TU Dortmund University especially Mustafa, Haniyeh, Matthias, Jacob, Florian, Van and Kiet. It has been a great three years and a great pleasure for me to be completing my research with such a great team. I further acknowledge the World Climate Research Program’s Working Group on Coupled Modelling, which is responsible for CMIP, and I thank the climate modeling groups for producing and making their model output available. Finally, the work would not materialize without the financial support from the DAAD NaWaM Program, and the German Federal Ministry of Education and Research (BMBF).
ii ABSTRACT Vu Gia- Thu Bon River Basin, located in the Central Coastal Zone of Viet Nam faces water shortage problems. This is expected to be further exacerbated in the future as a result of climate change. Previous attempts in addressing water shortage in the area followed a traditional top-down, predict-then-act approach. In such an approach, General Circulation Model outputs simulating future climate conditions are downscaled then adaptation measures proposed.
This approach could produce optimal adaptation solution under an intended future. However, given the uncertainties related to GCMs, the approach fails to provide satisfactory information for adaptation measures. This study utilizes a combined top-down and bottom-up climate change impact assessment instead. A MIKE BASIN water balance model is used to analyze the water system response in the Vu Gia- Thu Bon River Basin under different rainfall and temperature ranges.
Problematic conditions were then identified. Outputs from 25 GCMs were used to map the vulnerability space of the water system onto possible future climate conditions. A more detailed analysis of the system is thus performed only on problematic conditions suggesting both by the MIKE BASIN model and the GCM outputs. An analysis of the effects of current land use policy was performed to assist in the understanding of the changes in land policy and its effect on water usage.
This was done through analyzing satellite images between the years 2011 and 2016 during the land use master plan period of 2011-2020. The results obtained in the study suggest that at a minimum, 66.36 km2 of agricultural area would be facing water challenges in the future. Under more severe climate change conditions, up to 87.77 km2 of crops would be facing water shortages. Overall, there is a water deficit of between approximately 11 million and 21 million m 3 of water for agricultural production.
To meet the demand, the study proposes two lines of action, namely conserve/reduce use of water, and production of additional water. Conserving/reducing water usage could be achieved through changing crop types, irrigation practice, and introducing water efficient technologies. On the other hand, production of additional water includes the construction of more water reservoirs as well as to look into options such as seawater desalination. iii iv TABLE OF CONTENTS Acknowledgement.
iii Table of Contents. v List of Figures. ix List of Tables. 12 List of Abbreviations .2 Research Questions and Objectives .3 Structure of the Report .1 Climate Change Background .1 Climate and weather .2 Causes of climate change .3 Climate Change Modeling and Projections .2 Water Shortages and Climate Change .1 Process- driven modelling .2 Data- driven modelling .3 Conceptual hydrological models .4 Climate Change Impact Assessment Approaches .1 Top-down climate change assessment .2 Bottom-up climate change assessment .3 Combination of top-down and bottom-up approaches.
39 3 Study Area and Selection Justification .1 Overview of Study Area .2 Climate Variability and Extreme Weather Events .3 Previous Relevant Research in the Area .4 Research Gap and Justification .1 Hydrological and meteorological data .2 General circulation model outputs .3 Socio-economic data .4 Satellite image data .1 Identification of Climate Hazard and Threshold .2 Rainfall-runoff model .3 Water demand model .3 Climate Risk Discoveries .4 Tailoring Climate Information to Assist Decision Making .5 Current Status and Effects of Land Use Policies. 82 5 Results and Discussions .1 Climate Hazards and Thresholds.1 Rainfall-runoff model .2 Water demand model .3 Climate Risks Discoveries .1 Baseline results without upstream reservoir .2 Baseline results with upstream reservoir .3 Climate vulnerability space.4 Tailoring Climate Information to Assist Decision Making .5 Current Status and Effects of Land Use Policies .2 Land cover change results .6 Adaptation Policy Proposal .1 Fulfilling Research Objectives.2 Limitations of the Research. 159 Appendix A: List of CMIP5 models used. 159 Appendix B: SWSI values for drought years.
160 vii viii LIST OF FIGURES Figure 2-1: Main drivers of climate change (IPCC, 2007a). 23 Figure 2-2: Schematic of a GCM grid (IPCC, 2013b). 26 Figure 2-3: Runoff processes (US Army Corps of Engineers, 2000). 33 Figure 2-4: Top- down approach (Dessai and Hulme, 2004).
36 Figure 2-5: Bottom-up approach (Dessai and Hulme, 2004). 38 Figure 2-6: Scenario-neutral conceptual framework (Prudhomme et al. 39 Figure 2-7: Conceptual framework used by Wilby and Dessai (2010). 40 Figure 2-8: Framework from Bhave et al.
41 Figure 2-9: Future Visioning Process (Shaw et al., 2009; Sheppard et al. 42 Figure 2-10: The Decision Scaling Framework (Brown et al. 43 Figure 3-1: Location of the study area. 46 Figure 3-2: Topography of the study area.
47 Figure 3-3: Average monthly rainfall and evaporation (data source: IMHEN). 49 Figure 3-4: Uncertainties in a top-down approach (Wilby and Dessai, 2010). 55 Figure 3-5: Monitoring stations in the Vu Gia- Thu Bon River Basin. 57 Figure 3-6: High Resolution SPOT image for Da Nang City.
59 Figure 4-1: Overall Workflow of the research. 62 Figure 4-2: MIKE BASIN sub-basin delineation. 65 Figure 4-3: MIKE NAM processes and parameters. 66 Figure 4-4: Location of Nong Son and Thanh My catchments.
70 Figure 4-5: Irrigation zones in the MIKE BASIN model. 73 Figure 4-6: Schematic of important reservoir inputs. 78 Figure 4-7: Visualization of bi-linear interpolation. 81 Figure 4-8: Hierarchy classification scheme for land cover mapping.
86 ix Figure 4-9: Confusion matrix post classification. 87 Figure 4-10: Ground reference points for accuracy assessment. 88 Figure 5-1: SWSI of 1998 in comparison with other drought years. 93 Figure 5-2: Runoff at Nong Son gauge following the calibration process.
94 Figure 5-3: Runoff at Nong Son gauge following the validation process. 94 Figure 5-4: Runoff at Thanh My gauge following the calibration process. 95 Figure 5-5: Runoff at Thanh My gauge following the validation process. 95 Figure 5-6: MIKE BASIN model fully developed.
102 Figure 5-7: Water supply reliability without upstream reservoirs (baseline period) 103 Figure 5-8: Water supply reliability with upstream reservoirs (baseline period). 104 Figure 5-9: Reliability of node IRR_VG07. 106 Figure 5-10: Reliability of node IRR_VG09. 106 Figure 5-11: Reliability of node IRR_VG12.
107 Figure 5-12: Reliability of node IRR_VG13. 108 Figure 5-13: Reliability of node IRR_TB09. 109 Figure 5-14: Reliability of node IRR_TB13. 109 Figure 5-15: Reliability of node IRR_TB15.
110 Figure 5-16: Reliability of node IRR_TB21. 111 Figure 5-17: Reliability of node IRR_VG23. 111 Figure 5-18: VGTB land cover in 2011 using supervised classification. 118 Figure 5-19: VGTB land cover in 2016 using supervised classification.
119 Figure 5-20: VGTB land cover in 2011 using index-based approach. 120 Figure 5-21: VGTB land cover in 2016 using index based approach. 121 Figure 5-22: Example of empty-land covered with vegetation. 122 Figure 5-23: Comparison of Landsat 8 and SPOT 7 Images.
124 Figure 5-24: Paddy rice area converted in between 2011 and 2016. 127 x Figure 5-25: Conversion of agricultural area into built-up area. 128 Figure 5-26: Conversion of agricultural land into water bodies. 131 Figure 5-27: Conversion of agricultural area into vegetation.
132 Figure 5-28: Conversion of agricultural area into empty land. 133 xi LIST OF TABLES Table 3-1: Landsat satellite images used for the study. 60 Table 4-1: Model parameters in MIKE NAM. 66 Table 4-2: Weight of precipitation data used in Nong Son and Thanh My precipitation calculation.
70 Table 4-3: MIKE BASIN node corresponding to domestic water users. 72 Table 4-4: Irrigation nodes with corresponding irrigation area, precipitation, and meteorological station data. 76 Table 4-5: Land planning changes in Quang Nam and Da Nang until 2020. 83 Table 4-6: Description of land cover class classification.
84 Table 5-1: Drought and water shortage years from literature. 91 Table 5-2: SWSI value in year 1998 for Nong Son and Thanh My catchments. 92 Table 5-3: MIKE NAM corresponding NASH-Sutcliffe value. 96 Table 5-4: Calibrated MIKE NAM parameters.
96 Table 5-5: Industrial water demand and corresponding node in MIKE BASIN. 98 Table 5-6: Domestic water demand in the study area (calculated based on Vietnam Ministry of Construction (2006)). 99 Table 5-7: Domestic and industrial water demand (calculated based on Vietnam Ministry of Construction (2006)). 100 Table 5-8: Agricultural water demand under baseline condition (m 3/s) .
Nội dung được bảo vệ bản quyền — Tải xuống đầy đủ
Trích dẫn luận án này
Tra Van Tran (2018). Tích hợp khoa học khí hậu vào chính sách nước tại lưu vực sông Vu Gia-Thu Bon [Luận án tiến sĩ, TU Dortmund University]. LuanAn.net. https://luanan.net/giao-duc-hoc/tam-ly-hoc-giao-duc/tich-hop-khoa-hoc-khi-hau-vao-chinh-sach-nuoc-tai-luu-vuc-song-vu-gia-thu-bon
Câu hỏi thường gặp
Luận án "Tích hợp khoa học khí hậu vào chính sách nước tại lưu vực sông Vu Gia-Thu Bon" nghiên cứu về vấn đề gì?
Dịch vụ thảo luận và phản biện luận văn, giúp cải thiện nội dung, phát hiện lỗ hổng logic, tăng giá trị học thuật trước khi nộp.
Luận án "Tích hợp khoa học khí hậu vào chính sách nước tại lưu vực sông Vu Gia-Thu Bon" được bảo vệ tại trường nào?
Luận án này được bảo vệ tại TU Dortmund University. Năm bảo vệ: 2018.
Luận án "Tích hợp khoa học khí hậu vào chính sách nước tại lưu vực sông Vu Gia-Thu Bon" thuộc chuyên ngành gì?
Luận án "Tích hợp khoa học khí hậu vào chính sách nước tại lưu vực sông Vu Gia-Thu Bon" thuộc chuyên ngành Spatial Planning. Danh mục: Tâm Lý Học Giáo Dục.
Luận án "Tích hợp khoa học khí hậu vào chính sách nước tại lưu vực sông Vu Gia-Thu Bon" có bao nhiêu trang?
Luận án "Tích hợp khoa học khí hậu vào chính sách nước tại lưu vực sông Vu Gia-Thu Bon" có 165 trang. Bạn có thể xem trước một phần tài liệu ngay trên trang web trước khi tải về.
Cách tải luận án "Tích hợp khoa học khí hậu vào chính sách nước tại lưu vực sông Vu Gia-Thu Bon" về máy như thế nào?
Để tải luận án về máy, bạn nhấn nút "Tải xuống ngay" trên trang này, sau đó hoàn tất thanh toán phí lưu trữ. File sẽ được tải xuống ngay sau khi thanh toán thành công. Hỗ trợ qua Zalo: 0559 297 239.