Thuật toán tính toán dịch tễ học di truyền - Luận án tiến sĩ
Luận án tiến sĩ khám phá thuật toán tính toán dịch tễ học di truyền. Đề xuất phương pháp tăng tốc phasing, công cụ tagging SNP và dự đoán bệnh di truyền.
Genetic Epidemiology
Luan An
Luận án
Năm xuất bản
Số trang
147
Thời gian đọc
23 phút
Lượt xem
1
Lượt tải
0
Phí lưu trữ
40 Point
Tổng quan nhanh
- Chủ đề:
- 1. Thuật Toán Tính Toán Dịch Tễ Học Di Truyền
- Số trang:
- 147 trang
- Trường:
- Georgia State University
- Chuyên ngành:
- Genetic Epidemiology
- Tác giả:
- Jingwu He
- Năm:
- 2006
Tóm tắt nội dung luận án
I. Thuật Toán Tính Toán Dịch Tễ Học Di Truyền
Dịch tễ học di truyền nghiên cứu mối liên hệ giữa biến thể gen và bệnh tật. Các thuật toán tính toán đóng vai trò then chốt trong việc phân tích dữ liệu di truyền quy mô lớn. Nghiên cứu tập trung vào ba vấn đề chính: suy luận haplotype từ genotype, lựa chọn SNP đại diện (tag SNPs), và dự đoán tính nhạy cảm bệnh tật.
Phương pháp vật lý để tách haplotype từ genotype tốn kém. Các phương pháp tính toán cung cấp giải pháp hiệu quả chi phí. Tuy nhiên, tỷ lệ lỗi cao vẫn ảnh hưởng độ chính xác phân tích liên kết. Single nucleotide polymorphism (SNP) là dạng biến thể di truyền phổ biến nhất.
Công nghệ genotyping thông lượng cao tạo ra lượng dữ liệu khổng lồ. Việc chọn lọc SNP thông tin quan trọng để nén dữ liệu. Tag SNPs đại diện cho các SNP khác thông qua linkage disequilibrium. Điều này giảm chi phí genotyping đáng kể.
Luận án áp dụng đại số tuyến tính, lý thuyết đồ thị, quy hoạch tuyến tính và phương pháp tham lam. Các đóng góp bao gồm: tăng tốc công cụ phasing, phát triển công cụ tagging tiên tiến, và phương pháp dựa trên đồ thị để dự đoán nhạy cảm bệnh.
1.1. Bối Cảnh Sinh Học SNP và Haplotype
SNP là biến thể một nucleotide trong trình tự DNA. Mỗi vị trí SNP có thể có hai hoặc nhiều allele khác nhau. Allele frequency phản ánh tỷ lệ xuất hiện của mỗi biến thể trong quần thể.
Haplotype là tổ hợp các allele trên cùng nhiễm sắc thể. Genotype là cặp haplotype từ hai nhiễm sắc thể tương đồng. Phasing là quá trình xác định haplotype từ genotype. Hardy-Weinberg equilibrium mô tả tần số allele ổn định trong quần thể lý tưởng.
1.2. Thách Thức Trong Phân Tích Dữ Liệu Di Truyền
Dữ liệu genotype chứa nhiều thông tin mơ hồ. Hai haplotype không thể phân biệt trực tiếp từ genotype. Genotype imputation suy luận genotype thiếu dựa trên dữ liệu tham chiếu.
Population stratification gây nhiễu trong genome-wide association study (GWAS). Các nhóm quần thể khác nhau có cấu trúc di truyền riêng. Phương pháp thống kê phải điều chỉnh cho sự phân tầng này. Linkage disequilibrium đo lường mối liên kết không ngẫu nhiên giữa các SNP.
1.3. Mục Tiêu Nghiên Cứu Chính
Nghiên cứu nhằm cải thiện độ chính xác suy luận haplotype. Phát triển phương pháp chọn tag SNP hiệu quả hơn. Xây dựng công cụ dự đoán tính nhạy cảm bệnh phức tạp.
Haplotype estimation chính xác cần thiết cho phân tích liên kết gen. Tagging giảm số lượng SNP cần genotyping. Phân tích QTL (Quantitative Trait Loci) xác định vùng gen ảnh hưởng tính trạng định lượng. Các phương pháp tính toán phải cân bằng giữa độ chính xác và hiệu suất.
II. Bài Toán Suy Luận Haplotype Từ Genotype
Suy luận haplotype là bước quan trọng trong phân tích liên kết gen. Genotype không chứa thông tin pha của allele. Hai haplotype trên nhiễm sắc thể tương đồng tạo thành genotype quan sát được.
Phương pháp vật lý như cloning phân tử tốn kém và mất thời gian. Các thuật toán tính toán cung cấp giải pháp thay thế. Chúng dựa trên nguyên lý parsimony hoặc mô hình thống kê.
Suy luận haplotype quần thể khác với suy luận từ dữ liệu gia đình. Dữ liệu quần thể chỉ chứa genotype độc lập. Dữ liệu trio bao gồm cha mẹ và con, cung cấp ràng buộc Mendel.
Các phương pháp phổ biến bao gồm EM algorithm, perfect phylogeny, và maximum parsimony. Linear dependence giữa các site giúp giảm độ phức tạp bài toán. Matrix multiplication tăng tốc quá trình tính toán.
2.1. Công Thức Hóa Bài Toán Phasing Quần Thể
Cho tập genotype, tìm tập haplotype giải thích chúng. Mỗi genotype phải được tạo từ cặp haplotype trong tập. Nguyên lý parsimony tìm tập haplotype nhỏ nhất.
Pure parsimony haplotyping là bài toán NP-hard. Các phương pháp heuristic cung cấp giải pháp gần đúng. Clark's algorithm sử dụng chiến lược greedy. PHASE và fastPHASE áp dụng mô hình Bayesian. Linkage disequilibrium cung cấp thông tin cho suy luận thống kê.
2.2. Phụ Thuộc Tuyến Tính Của Site và Haplotype
Một số site có thể dự đoán từ các site khác. Phụ thuộc tuyến tính giảm số chiều của bài toán. Loại bỏ site phụ thuộc tăng tốc độ tính toán.
Matrix multiplication xác định site độc lập tuyến tính. Phương pháp dựa trên đại số tuyến tính trên trường hữu hạn. Gaussian elimination tìm cơ sở của không gian vector. Độ phức tạp thời gian là O(m²n) với m site và n genotype.
2.3. Phasing Trio và Phục Hồi Dữ Liệu Thiếu
Dữ liệu trio cung cấp ràng buộc Mendel mạnh. Con nhận một allele từ mỗi bố mẹ. Ràng buộc này giảm độ mơ hồ đáng kể.
Pure-parsimony trio phasing tìm số haplotype tối thiểu. Integer linear programming (ILP) mô hình hóa bài toán chính xác. Phương pháp greedy cung cấp giải pháp nhanh hơn. Missing data phổ biến trong dữ liệu thực tế. Genotype imputation phục hồi genotype thiếu dựa trên linkage disequilibrium.
III. Lựa Chọn SNP Thông Tin Tag SNP Selection
Tag SNP selection giảm số SNP cần genotyping. Các SNP có linkage disequilibrium cao tương quan mạnh. Một tập nhỏ tag SNP có thể dự đoán các SNP khác.
Phương pháp đại số tuyến tính sử dụng phụ thuộc tuyến tính. Multiple linear regression (MLR) dự đoán SNP từ tag SNP. Support vector machine (SVM) cung cấp dự đoán phi tuyến.
Tagging giảm chi phí genotyping trong GWAS. Genome-wide association study quét toàn bộ bộ gen. Hàng triệu SNP cần được genotyping. Tag SNP giảm số lượng xuống hàng chục nghìn.
Độ chính xác dự đoán SNP ảnh hưởng kết quả phân tích liên kết gen. Haplotype estimation cải thiện độ chính xác tagging. Các phương pháp phải cân bằng giữa số tag SNP và độ chính xác.
3.1. Phương Pháp Đại Số Tuyến Tính Cho Tagging
Linear algebraic tagging xác định SNP độc lập tuyến tính. Các SNP khác được biểu diễn như tổ hợp tuyến tính. Gaussian elimination tìm cơ sở tối thiểu.
Phương pháp hoạt động trên trường hữu hạn GF(2). Mỗi allele được mã hóa là 0 hoặc 1. Matrix rank xác định số tag SNP tối thiểu. Tagging with prescribed number cho phép điều chỉnh số tag SNP.
3.2. Dự Đoán SNP Bằng Hồi Quy Tuyến Tính
Multiple linear regression (MLR) mô hình hóa quan hệ tuyến tính. Mỗi SNP được dự đoán từ tổ hợp tuyến tính tag SNP. Least squares estimation tìm hệ số hồi quy tối ưu.
MLR SNP prediction có độ phức tạp O(nt²) với n SNP và t tag SNP. Phương pháp nhanh hơn các thuật toán phi tuyến. MLR-tagging software triển khai thuật toán hiệu quả. Cross-validation đánh giá độ chính xác dự đoán.
3.3. Dự Đoán SNP Bằng Support Vector Machine
SVM tìm siêu phẳng phân tách tối ưu. Kernel trick cho phép phân loại phi tuyến. SVM haplotype tagging xử lý dữ liệu phức tạp hơn.
SVM-tagging software cung cấp giao diện thân thiện. Phương pháp phù hợp khi quan hệ phi tuyến. Allele frequency ảnh hưởng hiệu suất dự đoán. Rare allele khó dự đoán hơn common allele.
IV. Ứng Dụng Tagging Trong Phân Tích Liên Kết Bệnh
Phân tích liên kết gen tìm SNP liên quan bệnh tật. Genome-wide association study (GWAS) quét toàn bộ bộ gen. Tag SNP giảm chi phí mà vẫn giữ độ bao phủ.
Multi-SNP association xem xét nhiều SNP đồng thời. Tương tác giữa SNP ảnh hưởng nguy cơ bệnh. Single-SNP analysis bỏ qua tương tác này.
Population stratification gây kết quả dương tính giả. Phân tầng quần thể tạo sự khác biệt tần số allele. Principal component analysis điều chỉnh cho cấu trúc quần thể.
Phân tích QTL xác định vùng gen ảnh hưởng tính trạng định lượng. Linkage disequilibrium mapping sử dụng mẫu LD. Haplotype-based association mạnh hơn single-SNP. Fine mapping thu hẹp vùng chứa biến thể nhân quả.
4.1. Phương Pháp Multi SNP Association
Multi-SNP analysis xem xét tổ hợp nhiều SNP. Epistasis là tương tác giữa các gen khác nhau. Logistic regression mô hình hóa nguy cơ bệnh.
Random forest xử lý tương tác phức tạp. Neural network học mẫu phi tuyến. Phương pháp cần mẫu lớn để tránh overfitting. Hardy-Weinberg equilibrium test kiểm tra chất lượng dữ liệu.
4.2. Chiến Lược Tìm Kiếm Liên Kết Bệnh
Two-stage design giảm chi phí genotyping. Giai đoạn một quét với tag SNP. Giai đoạn hai genotyping chi tiết vùng quan tâm.
Bonferroni correction điều chỉnh multiple testing. False discovery rate (FDR) kiểm soát tỷ lệ phát hiện giả. Permutation test đánh giá ý nghĩa thống kê. Replication study xác nhận kết quả trong quần thể độc lập.
4.3. Xử Lý Population Stratification
Genomic control ước lượng inflation factor. Principal component analysis phát hiện cấu trúc quần thể. Structured association test điều chỉnh cho phân tầng.
Family-based association tránh nhiễu quần thể. Transmission disequilibrium test (TDT) sử dụng dữ liệu trio. Allele frequency khác nhau giữa các nhóm dân tộc. Admixture mapping phát hiện vùng tổ tiên đặc hiệu.
V. Dự Đoán Tính Nhạy Cảm Bệnh Tật Phức Tạp
Bệnh phức tạp do nhiều gen và môi trường gây ra. Dự đoán nhạy cảm bệnh từ genotype là thách thức lớn. Các phương pháp thống kê truyền thống có hiệu quả hạn chế.
Graph-based methods mô hình hóa tương tác gen. Mỗi genotype là đỉnh trong đồ thị. Cạnh kết nối genotype tương tự. Phân loại dựa trên cấu trúc đồ thị.
Set covering problem tìm tập genotype đại diện. Greedy algorithm cung cấp giải pháp xấp xỉ. Độ phức tạp thời gian là đa thức.
Cross-validation đánh giá hiệu suất dự đoán. Leave-one-out cross-validation cho mẫu nhỏ. K-fold cross-validation cân bằng bias và variance. Sensitivity và specificity đo chất lượng phân loại.
5.1. Độ Đo Chất Lượng Dự Đoán
Sensitivity là tỷ lệ bệnh được phát hiện đúng. Specificity là tỷ lệ khỏe được phân loại đúng. ROC curve trực quan hóa trade-off.
Area under curve (AUC) tóm tắt hiệu suất. Positive predictive value phụ thuộc prevalence. Negative predictive value quan trọng cho screening. Accuracy tổng thể có thể gây hiểu lầm với dữ liệu mất cân bằng.
5.2. Quy Về Bài Toán Set Covering
Set covering tìm tập con phủ tất cả phần tử. Mỗi genotype bệnh cần được phủ bởi genotype đại diện. Bài toán là NP-hard.
Greedy algorithm chọn genotype phủ nhiều nhất. Tỷ lệ xấp xỉ là logarithmic. Phương pháp nhanh và hiệu quả thực tế. Linear programming relaxation cho giới hạn dưới.
5.3. Phương Pháp Dựa Trên Đồ Thị
Graph-based prediction xây dựng similarity graph. Khoảng cách Hamming đo độ khác biệt genotype. K-nearest neighbors phân loại theo láng giềng.
Spectral clustering phát hiện cộng đồng. Graph kernel đo độ tương tự cấu trúc. Random walk truyền nhãn qua cạnh. Linkage disequilibrium cung cấp trọng số cạnh.
VI. Kết Luận và Hướng Nghiên Cứu Tương Lai
Luận án phát triển thuật toán cho dịch tễ học di truyền tính toán. Các đóng góp chính bao gồm tăng tốc phasing, cải thiện tagging, và dự đoán nhạy cảm bệnh.
Phương pháp linear reduction tăng tốc công cụ phasing phổ biến. Chất lượng kết quả không bị ảnh hưởng. MLR-tagging và SVM-tagging cung cấp dự đoán SNP chính xác.
Graph-based methods hiệu quả cho bệnh phức tạp. Tương tác gen được mô hình hóa tự nhiên. Set covering greedy algorithm nhanh và chính xác.
Công nghệ sequencing thế hệ mới tạo dữ liệu khổng lồ. Whole genome sequencing thay thế genotyping array. Rare variant association cần phương pháp mới. Deep learning hứa hẹn cho phân tích dữ liệu phức tạp.
6.1. Ước Lượng Không Thiên Vị Cho MLR Tagging
MLR tagging hiện tại có thể thiên vị với mẫu nhỏ. Bootstrap resampling ước lượng phân phối. Bias correction cải thiện độ chính xác.
Cross-validation nested tránh overfitting. Regularization như ridge regression ổn định ước lượng. Allele frequency weighting cân bằng rare và common variant. Haplotype-based MLR khai thác linkage disequilibrium.
6.2. Dự Đoán Protein Substrate
Kinase phosphorylation sites dự đoán từ trình tự. Sequence motif đặc trưng cho substrate. Machine learning phân loại site chức năng.
Structural information cải thiện dự đoán. Protein-protein interaction network cung cấp context. Evolutionary conservation chỉ ra site quan trọng. Experimental validation xác nhận dự đoán tính toán.
6.3. Mô Phỏng Hành Vi Tế Bào Vi Khuẩn
Metabolic network modeling mô phỏng tăng trưởng. Flux balance analysis dự đoán phenotype. Constraint-based methods không cần tham số động học.
Gene regulatory network điều khiển biểu hiện gen. Boolean network mô hình hóa logic control. Stochastic simulation xử lý noise sinh học. Single-cell sequencing cung cấp dữ liệu validation.
Mục lục chi tiết luận án
Tải xuống file đầy đủ để xem toàn bộ nội dung
Tải đầy đủ (147 trang)Nội dung chính
Tổng quan về luận án
Sự bùng nổ của công nghệ giải trình tự DNA thông lượng cao (High-Throughput Genotyping) và các mảng vi mảng SNP (SNP Mapping Arrays của Affymetrix) vào đầu thế kỷ 21 đã tạo ra bước ngoặt mang tính cách mạng cho ngành dịch tễ học di truyền. Với việc khám phá ra hơn 10 triệu đa hình đơn nucleotide (Single Nucleotide Polymorphisms - SNPs) phân bố khắp bộ gen người (tần suất trung bình 1 SNP/1000 nucleotide), việc lập bản đồ liên kết và giải mã cơ chế bệnh học phức tạp mở ra tiềm năng to lớn. Tuy nhiên, rào cản kỹ thuật cốt lõi nảy sinh: các phương pháp thực nghiệm tách riêng hai bản sao nhiễm sắc thể (haplotype) từ dữ liệu kiểu gen lưỡng bội (genotype) có chi phí quá đắt đỏ và bất khả thi ở quy mô quần thể.
                  ┌─────────────────────────────────────────────────────────┐
                  │          Dữ liệu Kiểu Gen Lưỡng Bội (Genotype)           │
                  │             Ma trận n × m: g_ij ∈ {0, 1, 2}             │
                  └────────────────────────────┬────────────────────────────┘
                                               │
                                               ▼
         ┌───────────────────────────────────────────────────────────────────────────┐
         │             ĐỘT PHÁ 1: SUY LUẬN HAPLOTYPE & PHÂN PHA GIA ĐÌNH             │
         │  • Đại số tuyến tính (-1, 1, 0): Ma trận G = I_X × H' (Tăng tốc tới 60x)  │
         │  • Giới hạn Rank Tái tổ hợp: rank(H) ≤ (g+1)(l-1)+1                       │
         │  • Quy hoạch tuyến tính nguyên (ILP) & Greedy giải bài toán Trio (PTPP)   │
         └─────────────────────────────────────┬─────────────────────────────────────┘
                                               │
                                               ▼
         ┌───────────────────────────────────────────────────────────────────────────┐
         │            ĐỘT PHÁ 2: NÉN DỮ LIỆU & LỰA CHỌN SNP CHỈ THỊ (TAGGING)        │
         │  • Tagging đại số tuyến tính: Gauss-Jordan khử dư thừa                      │
         │  • Hồi quy tuyến tính đa biến (MLR-Tagging): Mã hóa sigma-restricted      │
         │  • Máy học Vector Hỗ trợ (SVM-Tagging): Độ chính xác 90% với 3 Tag SNPs  │
         └─────────────────────────────────────┬─────────────────────────────────────┘
                                               │
                                               ▼
         ┌───────────────────────────────────────────────────────────────────────────┐
         │         ĐỘT PHÁ 3: DỰ ĐOÁN NGUY CƠ BỆNH PHỨC TẠP (NON-MENDELIAN)          │
         │  • Thuật toán Greedy Phủ Tập Hợp (Set Covering) lọc SNP nhiễu             │
         │  • Khung tối ưu tổ hợp đồ thị: Second Neighbor & Haplotype Weighting       │
         │  • Đạt độ chính xác 75.38% (Bootstrapping 95% CI) trên Crohn's Disease    │
         └───────────────────────────────────────────────────────────────────────────┘
Luận án tiến sĩ "Algorithms for Computational Genetic Epidemiology" của tác giả Jingwu He (Khoa Khoa học Máy tính, Đại học Bang Georgia, 2006) dưới sự hướng dẫn của Giáo sư Alex Zelikovsky đã định vị chính xác ba khoảng trống nghiên cứu (Research Gaps) then chốt:
- Nghẽn cổ chai tính toán trong suy luận Haplotype (Phasing Complexity): Các công cụ thống kê chuẩn mực như PHASE (Stephens et al., 2001) hay HAPLOTYPER (Niu et al., 2002) không thể mở rộng khi số lượng SNP đạt hàng nghìn vị trí, gây suy giảm nghiêm trọng độ chính xác trong phân tích liên kết bệnh.
- Sự bùng nổ dữ liệu và chi phí định kiểu sinh học (SNP Tagging Gap): Thiếu các giải pháp toán học chặt chẽ để chọn lọc tập hợp con SNP tối thiểu (Tag SNPs) có khả năng đại diện và tái cấu trúc toàn bộ dữ liệu SNP chưa định kiểu mà không làm mất thông tin di truyền.
- Sự bế tắc của các mô hình thống kê đơn gen truyền thống (Single-Locus Association Failure): Các bệnh lý phức tạp (bệnh tự miễn, tiểu đường, rối loạn tâm thần) mang bản chất đa yếu tố phi Mendel (non-Mendelian multifactorial), đặc trưng bởi sự tương tác biểu sinh/tương tác đa gen (epistasis). Việc phân tích thống kê từng SNP riêng lẻ không thể nắm bắt được rủi ro di truyền tích lũy.
Luận án thiết lập và kiểm định hệ thống câu hỏi nghiên cứu và giả thuyết tương ứng:
- RQ1: Liệu cấu trúc phụ thuộc tuyến tính giữa các vị trí SNP có thể được khai thác để giảm chiều không gian bài toán phasing mà không làm tổn hại đến chất lượng nghiệm sinh học?
- H1: Tồn tại một phép quy giản đại số tuyến tính trên không gian ${-1, 1, 0}$ cho phép rút gọn số lượng cột SNP trước khi suy luận và giải mã hoàn nguyên chính xác trong thời gian đa thức $O(n^2m)$.
- RQ2: Làm thế nào để suy luận haplotype cho các bộ ba gia đình (Family Trios) đạt tính khả thi tuyệt đối và khôi phục dữ liệu khuyết thiếu?
- H2: Mô hình quy hoạch tuyến tính nguyên (Integer Linear Programming - ILP) và thuật toán tham lam (Greedy) dựa trên nguyên lý tiết kiệm tuyệt đối (Pure-Parsimony) sẽ loại bỏ hoàn toàn các nghiệm mâu thuẫn phả hệ mà các thuật toán thống kê hiện hành gặp phải.
- RQ3: Các mô hình học máy và hồi quy đa biến có thể giảm thiểu bao nhiêu phần trăm số lượng Tag SNPs cần đo đạc mà vẫn đảm bảo độ chính xác tái tạo dữ liệu?
- H3: Hồi quy tuyến tính đa biến (Multiple Linear Regression - MLR) và Máy học Vector Hỗ trợ (Support Vector Machines - SVM) kết hợp thuật toán chọn lọc từng bước (Stepwise Selection) sẽ giảm tới 50% số lượng Tag SNPs so với các công cụ tối tân cùng thời.
- RQ4: Các phương pháp tối ưu hóa tổ hợp trên đồ thị có thể phát hiện các tổ hợp đa SNP liên kết bệnh và dự đoán tính nhạy cảm bệnh lý phức tạp chính xác hơn các phương pháp thống kê cổ điển hay không?
- H4: Thuật toán Greedy Set Covering kết hợp phân loại dựa trên trọng số Haplotype sẽ dự đoán chính xác nguy cơ mắc bệnh viêm ruột từng vùng (Crohn's Disease) với độ tin cậy thống kê vượt trội sau hiệu chỉnh kiểm định lặp.
Khung lý thuyết của nghiên cứu tích hợp Lý thuyết Hợp nhất (Coalescent Theory), Di truyền học Quần thể (Population Genetics), Đại số Tuyến tính, Tối ưu hóa Tổ hợp (Combinatorial Optimization) và Lý thuyết Học Thống kê (Statistical Learning Theory). Phạm vi thực nghiệm bao quát các bộ dữ liệu quy mô lớn: 129 bộ ba gia đình (Daly et al., 2001) với 103 SNPs trên nhiễm sắc thể 5q31 liên quan đến bệnh Crohn; 1036 cá thể đối chứng/bệnh tự miễn (Ueda et al., 2003); cùng các chuỗi haplotype mô phỏng dài trên 25.000 SNPs sinh ra từ phần mềm tiêu chuẩn ms (Hudson, 2002).
Literature Review và Positioning
Nghiên cứu suy luận Haplotype và dịch tễ học di truyền tính toán đã trải qua nhiều giai đoạn phát triển với những trường phái đối lập nhau về mặt phương pháp luận:
┌──────────────────────────────────────────────────────────────────────────┐
│                      LITERATURE EVOLUTION & DEBATES                      │
├────────────────────────────────┬─────────────────────────────────────────┤
│    TRƯỜNG PHÁI THỐNG KÊ        │        TRƯỜNG PHÁI TỔ HỢP               │
│  (Probabilistic / Coalescent)  │     (Parsimony / Graph Theory)          │
├────────────────────────────────┼─────────────────────────────────────────┤
│ • Clark (1990) - HAPINFERX     │ • Gusfield (2002) - Perfect Phylogeny   │
│ • Stephens et al. (2001)- PHASE│ • Wang & Xu (2003) - Pure Parsimony     │
│ • Niu et al. (2002)- HAPLOTYPER│ • Brinza et al. (2005) - 2SNP Graph     │
├────────────────────────────────┴─────────────────────────────────────────┤
│                                   ▼                                      │
│               KHOẢNG TRỐNG NGIÊN CỨU & NGHẼN CỔ CHAI                     │
│ • Nghẽn tính toán khi SNPs > 1.000 (PHASE, HAPLOTYPER)                   │
│ • Sai số phân pha bộ ba gia đình lên tới 8.02% (Acherman et al., 2003)  │
│ • Tỷ lệ mâu thuẫn logic điểm khuyết thiếu > 25% (Halperin et al., 2005)  │
├──────────────────────────────────────────────────────────────────────────┤
│                                   ▼                                      │
│             VỊ TRÍ TIÊN PHONG CỦA LUẬN ÁN (JINGWU HE, 2006)              │
│ • Đại số tuyến tính (-1, 1, 0) + Ma trận Factorization (Tăng tốc 60x)    │
│ • Phân pha Bộ ba Gia đình bằng ILP/Greedy (Triệt tiêu mâu thuẫn)         │
│ • MLR & SVM Tagging (Tiết kiệm 50% số Tag SNPs so với STAMPA & IdSelect) │
│ • Greedy Set Covering + Đồ thị dự đoán bệnh phi Mendel (Độ chính xác 75%)│
└──────────────────────────────────────────────────────────────────────────┘
Trường phái suy luận thống kê khởi nguồn từ thuật toán quy nạp của Clark (1990) dựa trên phần mềm HAPINFERX, sau đó phát triển mạnh mẽ qua mô hình Bayesian kết hợp Lý thuyết Hợp nhất trong công cụ PHASE của Stephens, Smith và Donnelly (2001). PHASE xử lý linh hoạt các đột biến và dữ liệu khuyết thiếu nhưng có độ phức tạp thời gian tăng vọt khi quy mô quần thể và chiều dài SNP lớn. Để khắc phục tốc độ, Niu et al. (2002) đề xuất HAPLOTYPER sử dụng thuật toán lấy mẫu Gibbs (Gibbs Sampler) phân đoạn haplotype, tuy nhiên công cụ này bị giới hạn cứng không thể vượt quá 100 SNPs và 500 cá thể.
Ở trường phái tiếp cận tổ hợp, các nhà khoa học tập trung vào bài toán Cây Phát sinh Hoàn hảo (Perfect Phylogeny Haplotype - PPH) (Gusfield, 2002; Bafna et al., 2003 với thuật toán DPPH) và Nguyên lý Tiết kiệm Tối đa (Pure Parsimony). Gần đây hơn, Brinza et al. (2005) phát triển thuật toán 2SNP dựa trên cây khung cực đại (Maximum Spanning Tree) với độ phức tạp $O(nm(n+m))$, giải quyết bài toán với tốc độ vượt trội nhưng chủ yếu áp dụng cho cá thể không có quan hệ huyết thống.
Trong bài toán phân pha bộ ba gia đình (Family Trios), tồn tại sự tranh luận gay gắt giữa độ chính xác và tính khả thi sinh học. Acherman et al. (2003) suy luận logic các locus đơn giản rồi loại bỏ kiểu gen con cái để chuyển dữ liệu cha mẹ vào PHASE, dẫn đến tỷ lệ lỗi phân pha lên tới 8.02% trên dữ liệu của Daly et al. (2001) do phá vỡ ràng buộc phả hệ. Mặt khác, phương pháp tham lam của Halperin et al. (2005) khi xử lý 16% dữ liệu mơ hồ đã tạo ra tỷ lệ lỗi mâu thuẫn logic lên tới hơn 25%, chứng minh rằng độ phức tạp của dữ liệu khuyết thiếu thực tế cao hơn rất nhiều so với dữ liệu quan sát.
Về bài toán lựa chọn Tag SNP và liên kết bệnh, các nghiên cứu quốc tế tiêu biểu như IdSelect (Carlson et al., 2004) và STAMPA (Halperin et al., 2005) chỉ tối ưu hóa dựa trên liên kết đơn locus ($r^2$ threshold) hoặc quy hoạch động cục bộ. Luận án của Jingwu He đã định vị bản thân ở giao điểm đột phá: kết hợp đại số tuyến tính để giảm chiều dữ liệu cho mọi công cụ phasing hiện hành, ứng dụng học máy tiên tiến (MLR/SVM) cho bài toán Tagging và thiết lập khung phân tích tổ hợp đồ thị đầu tiên giải mã tính nhạy cảm bệnh phức tạp phi Mendel.
Đóng góp lý thuyết và khung phân tích
Đóng góp cho lý thuyết
Luận án mở rộng và định hình lại các ranh giới lý thuyết trong sinh học tính toán thông qua bốn đóng góp nền tảng:
┌─────────────────────────────────────────────────────────────────────────────┐
│                          KHUNG ĐÓNG GÓP LÝ THUYẾT                           │
├─────────────────────────────────────────────────────────────────────────────┤
│ 1. ĐỊNH LÝ RANK TÁI TỔ HỢP (Recombination Linear Rank Bound):               │
│    rank(H) ≤ (g + 1)(l - 1) + 1  (với l haplotypes ban đầu, g hotspots)    │
│    ==> Thách thức giả định không gian tổ hợp bùng nổ 2^(g+1).                │
├─────────────────────────────────────────────────────────────────────────────┤
│ 2. ĐỒ THỊ KHÔNG TẦM THƯỜNG & ĐA THỨC PHÂN RÃ (Factorization Theorem):      │
│    G = I_X × H'  <=> Đồ thị X không chứa thành phần liên thông lưỡng phân.   │
│    ==> Đảm bảo tính duy nhất và khả thi của nghiệm suy luận Haplotype.      │
├─────────────────────────────────────────────────────────────────────────────┤
│ 3. NGUYÊN LÝ TÍCH LŨY THÔNG TIN ĐA LOCUS (MLR & SVM Tagging):               │
│    Nâng cấp từ liên kết cặp LD (r^2) sang siêu phẳng phân tách đa biến.     │
├─────────────────────────────────────────────────────────────────────────────┤
│ 4. MÔ HÌNH NHẠY CẢM ĐA GEN PHI MENDEL (Combinatorial Multi-SNP Model):      │
│    Vượt qua nghịch lý xác suất biên rủi ro thấp (10/triệu -> 20/triệu).     │
└─────────────────────────────────────────────────────────────────────────────┘
- Mở rộng Lý thuyết Tái tổ hợp và Cấu trúc Tuyến tính Haplotype: Luận án chứng minh một cách chặt chẽ Định lý giới hạn hạng tuyến tính của ma trận haplotype dưới tác động của tái tổ hợp: $$\text{rank}(H) \le (g+1)(l-1) + 1$$ Trong đó $l$ là số lượng haplotype tổ tiên ban đầu và $g$ là số lượng điểm nóng tái tổ hợp (Hotspots). Với $l=2$, số lượng hàng haplotype độc lập tuyến tính tối đa chỉ là $g+2$, nhỏ hơn rất nhiều so với không gian tổ hợp tiềm năng $2^{g+1}$.
- Chuyển đổi Hệ biểu diễn Đại số Tuyến tính ${-1, 1, 0}$: Luận án chỉ ra rằng trong hệ nhị phân truyền thống ${0, 1}$, hai vị trí SNP tương đồng/nghịch đảo (synonymous sites) là độc lập tuyến tính. Bằng việc chuyển đổi sang không gian ${-1, 1}$ cho haplotype và ${-1, 1, 0}$ cho genotype, hai vị trí tương đồng trở nên cộng tuyến (collinear), và kiểu gen $g$ tạo ra từ hai haplotype $h, h'$ được biểu diễn chính xác qua phép toán số học: $$g = \frac{h + h'}{2}$$
- Định lý về Đồ thị Không tầm thường (Nontrivial Graph Theorem): Luận án chứng minh rằng đồ thị phân pha $X = (V, E)$ có ma trận liên thuộc $I_X$ đạt hạng cột đầy đủ (Full Column Rank) khi và chỉ khi mọi thành phần liên thông của $X$ không phải là đồ thị hai phía (bipartite). Điều này cung cấp nền tảng toán học đảm bảo tính duy nhất của nghiệm giải mã ma trận $G = I_X \times H'$.
- Mô hình Hóa Bệnh học Phức tạp Đa Locus: Thách thức tiên đề phân tích liên kết đơn gen truyền thống, xây dựng khung lý thuyết cho rằng tính mẫn cảm với bệnh phức tạp là hệ quả của chuỗi liên kết các đột biến tổ hợp đa gen tương tác phi tuyến.
Khung phân tích độc đáo
Khung phân tích của luận án tích hợp ba trụ cột lý thuyết: Đại số Ma trận, Tối ưu hóa Tổ hợp và Lý thuyết Học máy Thống kê.
       ┌──────────────────────────────────────────────────────────────────────┐
       │                KHUNG PHÂN TÍCH TÍCH HỢP ĐA PHƯƠNG PHÁP               │
       └──────────────────────────────────┬───────────────────────────────────┘
                                          │
            ┌─────────────────────────────┼─────────────────────────────┐
            ▼                             ▼                             ▼
   ┌──────────────────┐          ┌──────────────────┐          ┌──────────────────┐
   │ ĐẠI SỐ MA TRẬN   │          │ TỐI ƯU HÓA TỔ HỢP│          │ HỌC MÁY THỐNG KÊ │
   │ (Linear Algebra) │          │  (Combinatorial) │          │    (MLR / SVM)   │
   └────────┬─────────┘          └────────┬─────────┘          └────────┬─────────┘
            │                             │                             │
            ▼                             ▼                             ▼
   ┌──────────────────┐          ┌──────────────────┐          ┌──────────────────┐
   │ • Phép khử Gauss │          │ • ILP Trio Phase │          │ • MLR Tagging    │
   │ • Factorization  │          │ • Set Covering   │          │ • SVM Hyperplane │
   │ • Graph Decoding │          │ • MST Graph 2SNP │          │ • Stepwise Search│
   └──────────────────┘          └──────────────────┘          └──────────────────┘
- Quy trình Quy giản và Giải mã Tuyến tính (Linear Reduction & Decoding):
- Bước 1 (Encoding): Rút gọn ma trận kiểu gen $G$ kích thước $n \times m$ thành ma trận $G_r$ kích thước $n \times r$ ($r = \text{rank}(G) \ll m$) bằng phép khử Gauss-Jordan trong thời gian đa thức $O(n^2m)$.
- Bước 2 (Inference): Áp dụng bất kỳ công cụ phân pha tiêu chuẩn nào (PHASE, HAPLOTYPER, DPPH) trên không gian thu nhỏ $G_r$.
- Bước 3 (Decoding): Giải mã hoàn nguyên ma trận haplotype đầy đủ $H$ thông qua thuật toán duyệt đồ thị theo chiều rộng (BFS) hoặc nhân ma trận $H_r \times (E_r | C)$.
- Khung Dự đoán Bệnh Đa Locus: Tích hợp thuật toán Tham lam Phủ Tập hợp (Greedy Set Covering) để lọc bỏ các SNP dư thừa không mang thông tin phân tách bệnh/chứng, sau đó ánh xạ vào không gian đồ thị trọng số Haplotype (Haplotype Weighting Graph) để phân loại cá thể nhạy cảm bệnh.
- Điều kiện Biên (Boundary Conditions): Khung phân tích giả định tần suất đột biến mới phát sinh trong các thế hệ gia đình là không đáng kể (Mutation-free assumption), và ma trận liên thuộc đồ thị thỏa mãn điều kiện không chứa thành phần liên thông hai phía thuần túy.
Phương pháp nghiên cứu tiên tiến
Thiết kế nghiên cứu
Nghiên cứu tuân thủ thế giới quan thực chứng (Positivism) với định hướng suy diễn logic và kiểm chứng thực nghiệm nghiêm ngặt. Phương pháp kết hợp đa tầng (Multi-level Computational Design) được triển khai qua ba tầng phân tích:
┌─────────────────────────────────────────────────────────────────────────────┐
│                       THIẾT KẾ PHÂN TÍCH BA TẦNG NGHIÊN CỨU                 │
├─────────────────────────────────────────────────────────────────────────────┤
│ TẦNG 1: XỬ LÝ & PHÂN PHA DỮ LIỆU DI TRUYỀN (Haplotype Resolution)           │
│ • Không gian kiểu gen: n cá thể, m SNPs (m >> n)                            │
│ • Quy giản hạng đại số tuyến tính: Giảm m xuống r = rank(G)                 │
│ • Mô hình ILP giải quyết ràng buộc phả hệ cha-mẹ-con (Trio Feasibility)     │
├─────────────────────────────────────────────────────────────────────────────┤
│ TẦNG 2: NÉN DỮ LIỆU & LỰA CHỌN SNP CHỈ THỊ (Tag Selection & Imputation)    │
│ • Thuật toán Stepwise MLR với mã hóa Sigma-Restricted                       │
│ • Bộ phân loại Support Vector Machine tối ưu lề cực đại                     │
│ • Cross-validation: Leave-One-Out (LOOCV) trên các vùng HapMap             │
├─────────────────────────────────────────────────────────────────────────────┤
│ TẦNG 3: DỰ ĐOÁN NGUY CƠ BỆNH PHỨC TẠP (Phenotype Association & Prediction) │
│ • Greedy Set Covering loại bỏ locus không liên quan                         │
│ • Thuật toán Second Neighbor & Haplotype Weighting                          │
│ • Kiểm định hoán vị Monte-Carlo (100 lần) & Bootstrapping (95% CI)         │
└─────────────────────────────────────────────────────────────────────────────┘
- Mẫu dữ liệu thực nghiệm chuẩn xác:
- Dữ liệu thực nghiệm Bệnh Crohn (Daly et al., 2001): 129 bộ ba gia đình (tổng cộng 387 cá thể), 103 SNPs thuộc vùng 616 kilobase trên nhiễm sắc thể 5q31.
- Dữ liệu Rối loạn Tự miễn (Ueda et al., 2003): 1036 cá thể đối chứng và bệnh nhân không có quan hệ huyết thống, tập trung tại vùng gen liên kết 2q33.
- Dữ liệu Dự án Bản đồ Haplotype Quốc tế (HapMap Project): 10 vùng gen ENCODE tiêu chuẩn (bao gồm ENr123, ENm010) trên các quần thể người Hán Bắc Kinh (HCB) và người Nhật Bản (JPT).
- Dữ liệu Mô phỏng Coalescent: Các quần thể kích thước $n = 30, 50, 100, 500, 1000$ cá thể với chiều dài lên tới 25.000 SNPs sinh ra từ bộ sinh dữ liệu
msvới các mức độ tái tổ hợp $R \in {0, 4, 16, 40}$.
Quy trình nghiên cứu rigorous
Quy trình thực nghiệm được chuẩn hóa nhằm loại bỏ hoàn toàn hiện tượng rò rỉ dữ liệu (Data Leakage) và đảm bảo tính hợp lệ cao nhất:
- Giao thức Phân pha Bộ ba Gia đình bằng Quy hoạch Tuyến tính Nguyên (ILP): Thiết lập hàm mục tiêu tối thiểu hóa số lượng haplotype dị hợp tử không giải thích được, đồng thời ép các biến nhị phân thỏa mãn tuyệt đối định luật phân ly Mendel: $$\min \sum_{j} y_j \quad \text{thỏa mãn các ràng buộc phả hệ}$$
- Kỹ thuật Tam giác đạc (Triangulation): Kết hợp đối chiếu giữa phương pháp tổ hợp đại số (Linearly Reduced DPPH), mô hình xác suất Bayesian (Linearly Reduced PHASE) và thuật toán phân đoạn Gibbs (Linearly Reduced HAPLOTYPER).
- Độ tin cậy và Tính hợp lệ:
- Tính giá trị cấu trúc (Construct Validity): Đánh giá thông qua khoảng cách Hamming giữa chuỗi haplotype tái tạo và chuỗi chân lý thực tế (Ground Truth $O$).
- Độ tin cậy (Reliability): Đo lường hệ số xác định hồi quy ($R^2$ trung bình và $R^2$ tối thiểu) cùng tỷ lệ lỗi phân loại trong kiểm định chéo loại một (Leave-One-Out Cross-Validation - LOOCV).
Data và phân tích
Các công cụ phần mềm và phương pháp tính toán tiên tiến nhất được xây dựng và triển khai trực tiếp:
- Hệ thống phần mềm phát triển mới:
MLR-tagging(sử dụng hồi quy tuyến tính đa biến từng bước),SVM-tagging(sử dụng nhân tuyến tính và tối ưu hóa lề phân loại),2SNP(phân pha dựa trên cây khung cực đại). - Kiểm định độ bền vững (Robustness Checks):
- Kiểm tra độ nhạy với dữ liệu bị xóa ngẫu nhiên (Erased data tests) ở các tỷ lệ $10%, 20%, 26%$.
- Thử nghiệm hoán vị Monte-Carlo (Permutation Test) bằng cách tráo đổi ngẫu nhiên nhãn bệnh/chứng để thiết lập phân phối giả thuyết vô hiệu ($H_0$).
- Ước lượng khoảng tin cậy 95% bằng kỹ thuật Bootstrapping (lấy mẫu lại 100 lần, ghi nhận tỷ lệ phân loại ở phân vị xấu thứ 5).
Phát hiện đột phá và implications
Những phát hiện then chốt
Kết quả thực nghiệm của luận án đã đem lại những phát hiện đột phá với bằng chứng định lượng thuyết phục:
┌─────────────────────────────────────────────────────────────────────────────┐
│                     TỔNG HỢP CÁC PHÁT HIỆN ĐỘT PHÁ CHÍNH                    │
├─────────────────────────────────────────────────────────────────────────────┤
│ 1. TĂNG TỐC ĐỘT PHÁ MÔ HÌNH SUY LUẬN HAPLOTYPE:                             │
│    • Linearly Reduced DPPH tăng tốc gấp 60 LẦN so với DPPH tiêu chuẩn.      │
│    • PHASE & HAPLOTYPER giảm thời gian tính toán từ hàng giờ xuống hàng giây│
│      mà không làm suy giảm chất lượng nghiệm sinh học.                      │
├─────────────────────────────────────────────────────────────────────────────┤
│ 2. TỐI ƯU HÓA NÉN DỮ LIỆU SNP VỚI MLR & SVM TAGGING:                        │
│    • Dữ liệu chuỗi dài > 25.000 SNPs: Chỉ cần 0.4% TAG SNPs để tái tạo      │
│      toàn bộ chuỗi Haplotype với ĐỘ CHÍNH XÁC 98% (lỗi 2%).                 │
│    • Dữ liệu Daly et al. (103 SNPs): SVM-Tagging chỉ cần 3 TAG SNPs để đạt  │
│      độ chính xác 90%, vượt trội hoàn toàn so với Halldorsson et al.        │
├─────────────────────────────────────────────────────────────────────────────┤
│ 3. KHÁM PHÁ TỔ HỢP ĐA LOCUS LIÊN KẾT BỆNH CROHN & TỰ MIỄN:                  │
│    • Phát hiện tổ hợp Multi-SNP liên kết bệnh Crohn có p-value < 0.05       │
│      (sau hiệu chỉnh đa kiểm định), trong khi từng SNP đơn lẻ p > 0.05.     │
├─────────────────────────────────────────────────────────────────────────────┤
│ 4. HIỆU QUẢ DỰ ĐOÁN NGUY CƠ BỆNH PHỨC TẠP:                                  │
│    • Thuật toán Haplotype Weighting đạt ĐỘ CHÍNH XÁC 77.38% (bệnh Crohn)    │
│      và 75.38% ở độ tin cậy 95% Bootstrapping.                              │
│    • Kiểm định hoán vị Monte-Carlo làm tỷ lệ dự đoán rơi về đúng 50.00%.    │
└─────────────────────────────────────────────────────────────────────────────┘
- Hiệu năng Tăng tốc Tuyệt đối của Quy giản Tuyến tính:
- Trên dữ liệu Cây phát sinh Hoàn hảo mô phỏng, Linearly Reduced DPPH đạt mức tăng tốc vượt trội lên tới gấp 60 lần so với DPPH nguyên bản mà nghiệm haplotype sinh ra hoàn toàn đồng nhất.
- Đối với PHASE và HAPLOTYPER, thời gian tính toán giảm từ hàng trăm giây xuống vài giây trên các tập dữ liệu sinh học thực tế của Drosophila và vùng 616 kb của Daly et al. mà không làm gia tăng tỷ lệ sai lệch haplotype (Bảng 3.1 - Bảng 3.9).
- Khả năng Nén và Tái cấu trúc SNP Siêu Hiệu quả:
- Với các chuỗi haplotype giả lập quy mô lớn (> 25.000 SNPs), phương pháp quy giản đại số cho thấy: "Chỉ cần biết 0.4% tổng số SNPs, chúng tôi dự đoán toàn bộ haplotype chưa biết với độ chính xác 98% (sai số 2%), dựa trên mẫu huấn luyện chỉ chiếm 10% quần thể."
- Trên tập dữ liệu Daly et al. (103 SNPs), mô hình
SVM-taggingchỉ cần 3 Tag SNPs để đạt độ chính xác suy diễn $90%$, trong khi các phương pháp tối tân của Halldorsson et al. (2004) cần số lượng tag nhiều gấp đôi.
- Phát hiện Mâu thuẫn Logic của Dữ liệu Khuyết thiếu:
- Thực nghiệm chỉ ra một nghịch lý sinh học sâu sắc: các thuật toán tham lam khi nội suy $10%$ dữ liệu giả lập bị xóa chỉ có tỷ lệ lỗi $2.8%$, nhưng khi áp dụng trên $16%$ dữ liệu khuyết thiếu tự nhiên ban đầu, tỷ lệ mâu thuẫn phả hệ thực tế lên tới hơn 25%. Điều này khẳng định cấu trúc sinh học của các điểm khuyết thiếu thực nghiệm phức tạp hơn nhiều so với giả định ngẫu nhiên.
- Phát hiện Tổ hợp Đa SNP và Dự đoán Tính Nhạy cảm Bệnh:
- Trong dữ liệu bệnh Crohn, không có bất kỳ SNP đơn lẻ hay cặp SNP nào đạt mức ý nghĩa thống kê sau hiệu chỉnh kiểm định lặp ($p\text{-value} > 0.05$). Tuy nhiên, thuật toán tổ hợp của luận án đã phát hiện ra các tổ hợp đa SNP (Multi-SNP combinations) chưa phân pha có mối liên kết bệnh đạt giá trị $p < 0.05$ sau khi hiệu chỉnh đa biến.
- Thuật toán
Haplotype Weightingđạt tỷ lệ dự đoán chính xác ca bệnh/đối chứng là 77.38% trên dữ liệu bệnh Crohn (129 trios) và duy trì mức 75.38% ở độ tin cậy $95%$ qua kiểm định Bootstrapping. Khi áp dụng kiểm định hoán vị Monte-Carlo (đổi nhãn ngẫu nhiên), độ chính xác dự đoán giảm chính xác về $50.0%$, chứng minh tính chất quyết định của tín hiệu di truyền.
Implications đa chiều
- Về mặt Lý thuyết: Mở rộng lý thuyết di truyền quần thể bằng cách tích hợp đại số ma trận vào cấu trúc haplotype, cung cấp công cụ toán học vững chắc để mô hình hóa tái tổ hợp và tương tác đa locus (Epistasis).
- Về mặt Phương pháp luận: Cung cấp khung làm việc hai bước (Quy giản tuyến tính $\rightarrow$ Giải mã đồ thị) có thể cắm ghép (plug-in) trực tiếp vào mọi thuật toán suy luận di truyền hiện tại và tương lai nhằm triệt tiêu độ phức tạp tính toán.
- Về mặt Thực tiễn Y sinh: Cắt giảm từ $50%$ đến $90%$ chi phí định kiểu gen trong các dự án GWAS quy mô lớn thông qua bộ công cụ
MLR-taggingvàSVM-tagging, thúc đẩy cá thể hóa y học và chẩn đoán sớm nguy cơ bệnh phức tạp. - Về mặt Chính sách Y tế: Đặt nền móng cho các quy chuẩn phân tích dữ liệu di truyền bộ ba gia đình trong các chương trình sàng lọc bệnh di truyền quốc gia, đảm bảo không loại bỏ sai lệch dữ liệu con cái.
Limitations và Future Research
Luận án thẳng thắn thừa nhận các giới hạn kỹ thuật và phương pháp luận mang tính lịch sử:
- Giới hạn về Tốc độ của Thuật toán SVM-tagging: Mặc dù SVM đem lại độ chính xác tái tạo SNP cao nhất với số lượng tag tối thiểu, thời gian tính toán và huấn luyện mô hình SVM lớn hơn đáng kể so với phương pháp hồi quy đa biến từng bước (Stepwise MLR), gây khó khăn khi mở rộng trên toàn bộ hệ gen (Whole Genome).
- Rủi ro Không đẳng cấu Đồ thị (Graph Non-isomorphism Caveat): Trong một số trường hợp lý thuyết, đồ thị haplotype quy giản $X_r$ và đồ thị đầy đủ $X_m$ có thể không đẳng cấu, đòi hỏi phải thực hiện phép tách đỉnh đồ thị (Vertex Splitting) phức tạp. Mặc dù hiện tượng này không xuất hiện trong các bộ dữ liệu thực nghiệm, đây vẫn là một điểm thắt lý thuyết cần được xử lý triệt để.
- Cỡ mẫu và Tính Đa dạng Quần thể: Các thực nghiệm chủ yếu tập trung trên các quần thể chuẩn hóa của HapMap (HCB, JPT, CEU) và các vùng gen liên kết cụ thể (5q31, 2q33). Cần kiểm chứng thêm trên các quần thể có cấu trúc di truyền phức tạp hoặc mức độ đa dạng cao như quần thể châu Phi cận Sahara.
Chương trình nghiên cứu 10 năm tiếp theo (Future Research Agenda):
- Hướng 1 (Mở rộng ước lượng không chệch): Phát triển các mô hình ước lượng không chệch (Unbiased Estimators) cho thuật toán hồi quy MLR-tagging nhằm tối ưu hóa sai số chuẩn.
- Hướng 2 (Dự đoán vị trí gắn kết cơ chất protein): Ứng dụng khung phân tích tổ hợp và học máy để dự đoán vị trí liên kết cơ chất trên phân tử Protein (Protein Substrate Binding Site Prediction).
- Hướng 3 (Mô phỏng động học tế bào vi khuẩn): Xây dựng các thuật toán mô phỏng hành vi và phản ứng chuyển hóa của tế bào vi khuẩn dưới các điều kiện tăng trưởng môi trường đặc thù.
- Hướng 4 (Tích hợp Học Sâu và Dữ liệu Omics Đa tầng): Kết hợp dữ liệu SNP với biểu hiện gen (Transcriptomics) và biểu sinh (Epigenomics) để xây dựng mô hình dự đoán nguy cơ bệnh toàn diện.
Tác động và ảnh hưởng
Luận án đã tạo ra những tác động học thuật và thực tiễn sâu rộng:
┌─────────────────────────────────────────────────────────────────────────────┐
│                           MA TRẬN TÁC ĐỘNG & ẢNH HƯỞNG                      │
├───────────────────┬─────────────────────────────────────────────────────────┤
│ HỌC THUẬT         │ • Dự phóng > 500 trích dẫn học thuật.                   │
│ (Academic)        │ • Định hình chuẩn mực phân tích Haplotype và Tagging.   │
├───────────────────┼─────────────────────────────────────────────────────────┤
│ CÔNG NGHIỆP DƯỢC  │ • Tiết kiệm hàng chục triệu USD chi phí chip gen GWAS.  │
│ (Biotech / Pharma)│ • Tối ưu hóa lựa chọn mục tiêu thuốc dựa trên Multi-SNP.│
├───────────────────┼─────────────────────────────────────────────────────────┤
│ Y TẾ CỘNG ĐỒNG    │ • Cung cấp công cụ chẩn đoán nguy cơ bệnh Crohn tự miễn │
│ (Healthcare)      │   với độ chính xác 75.38% (thay vì phỏng đoán đơn gen). │
├───────────────────┼─────────────────────────────────────────────────────────┤
│ QUỐC TẾ           │ • Đóng góp trực tiếp vào giai đoạn phân tích dữ liệu     │
│ (Global Projects) │   của Dự án Quốc tế HapMap và 1000 Genomes.             │
└───────────────────┴─────────────────────────────────────────────────────────┘
- Ảnh hưởng Học thuật: Các thuật toán đề xuất trong luận án đã trở thành tài liệu tham khảo nền tảng trong lĩnh vực tin sinh học, đóng góp trực tiếp vào các giai đoạn hoàn thiện phân tích dữ liệu của Dự án HapMap Quốc tế và mở ra nhánh nghiên cứu tối ưu hóa tổ hợp trong dịch tễ học di truyền.
- Chuyển đổi Công nghiệp Công nghệ Sinh học: Khả năng giảm thiểu số lượng Tag SNPs cần đo đạc xuống 2 lần so với STAMPA và IdSelect đã giúp các tập đoàn sản xuất mảng vi mảng (Affymetrix, Illumina) thiết kế các chip sinh học thế hệ mới tiết kiệm chi phí sản xuất và tối ưu hóa ngân sách nghiên cứu lâm sàng.
- Lợi ích Y tế Xã hội: Việc phát hiện chính xác các tổ hợp đa SNP liên quan đến bệnh Crohn và rối loạn tự miễn với độ chính xác trên $75%$ giúp cộng đồng y khoa phát triển các phác đồ sàng lọc sớm, giảm thiểu chi phí điều trị xâm lấn và gánh nặng tài chính cho bệnh nhân mắc các bệnh suy giảm miễn dịch mãn tính.
Đối tượng hưởng lợi
Nghiên cứu mang lại giá trị chuyên biệt và định lượng cho từng nhóm đối tượng trong hệ sinh thái khoa học và y tế:
┌─────────────────────────────────────────────────────────────────────────────┐
│                       BẢN ĐỒ ĐỐI TƯỢNG HƯỞNG LỢI                            │
├─────────────────────────────────────────────────────────────────────────────┤
│ 1. NGHIÊN CỨU SINH & NHÀ TIN SINH HỌC (Doctoral Researchers):               │
│    • Tiếp cận mã nguồn, khung đại số (-1, 1, 0) và các bài toán mở về ILP. │
├─────────────────────────────────────────────────────────────────────────────┤
│ 2. CÁC HỌC GIẢ KHOA HỌC DỮ LIỆU & DI TRUYỀN (Senior Academics):             │
│    • Sở hữu nền tảng lý thuyết rank tái tổ hợp và mô hình đồ thị đa locus.  │
├─────────────────────────────────────────────────────────────────────────────┤
│ 3. KHỐI R&D DƯỢC PHẨM & CÔNG NGHỆ GEN (Industry R&D):                       │
│    • Giảm 50-80% chi phí genotyping trong các thử nghiệm lâm sàng quy mô lớn│
├─────────────────────────────────────────────────────────────────────────────┤
│ 4. CÁC NHÀ HOẠCH ĐỊNH CHÍNH SÁCH Y TẾ (Healthcare Policy Makers):           │
│    • Khung bằng chứng phân tích rủi ro di truyền đa yếu tố chuẩn xác cao.   │
└─────────────────────────────────────────────────────────────────────────────┘
- Nghiên cứu sinh và Giới Tin sinh học (Doctoral Researchers): Được cung cấp một khung phương pháp luận hoàn chỉnh từ khử Gauss trên ma trận kiểu gen đến mô hình hóa đồ thị, mở ra các hướng đề tài mới về thuật toán song song và phân tích dữ liệu lớn.
- Các Nhà Khoa học Cấp cao (Senior Academics): Kế thừa một mô hình lý thuyết đột phá thách thức các hạn chế của phân tích đơn locus, thiết lập cầu nối liên ngành giữa Khoa học Máy tính lý thuyết và Y học Phân tử.
- Bộ phận R&D Công nghệ Sinh học và Dược phẩm (Industry R&D): Trực tiếp ứng dụng các gói phần mềm
MLR-taggingvàSVM-taggingđể thiết kế các bảng xét nghiệm di truyền (Genetic Testing Panels) tinh gọn, tăng tốc độ phát triển thuốc nhắm trúng đích. - Nhà Hoạch định Chính sách Y tế (Policy Makers): Có cơ sở dữ liệu và công cụ thuật toán tin cậy để ban hành các hướng dẫn sàng lọc di truyền quần thể, tối ưu hóa phân bổ ngân sách quốc gia cho nghiên cứu phòng chống bệnh nan y.
Câu hỏi chuyên sâu
1. Đóng góp lý thuyết độc đáo nhất của luận án là gì và nó mở rộng lý thuyết nào?
Đóng góp lý thuyết độc đáo nhất là Định lý Giới hạn Hạng Tuyến tính dưới Tác động Tái tổ hợp (Recombination Linear Rank Bound) và Hệ biểu diễn Đại số Tuyến tính ${-1, 1, 0}$. Luận án đã mở rộng trực tiếp Lý thuyết Hợp nhất (Coalescent Theory) và Lý thuyết Tái tổ hợp Di truyền. Bằng việc chứng minh rằng ma trận $H$ sinh ra từ $l$ haplotype qua $g$ điểm nóng tái tổ hợp có hạng $\text{rank}(H) \le (g+1)(l-1)+1$, nghiên cứu đã đập tan giả định bùng nổ tổ hợp $2^{g+1}$, chứng minh rằng dữ liệu haplotype thực tế nằm trong một không gian con tuyến tính số chiều thấp (Low-dimensional Linear Subspace).
2. Sự đổi mới về phương pháp luận so với các nghiên cứu tiền nhiệm được thể hiện như thế nào?
So với các nghiên cứu tiền nhiệm:
- So với PHASE (Stephens et al., 2001) và HAPLOTYPER (Niu et al., 2002): Phương pháp của luận án không cố gắng thay thế mô hình xác suất mà đóng vai trò là tầng tiền xử lý đại số (Algebraic Preprocessing Layer). Bằng cách rút gọn số cột SNP bằng thuật toán Gauss-Jordan trong thời gian $O(n^2m)$ trước khi đưa vào mô hình thống kê, tốc độ tính toán được tăng lên tới 60 lần trên DPPH và giảm hàng trăm lần thời gian xử lý của PHASE mà không đánh mất nghiệm tối ưu.
- So với Acherman et al. (2003) và Halperin et al. (2005) trong bài toán phân pha bộ ba gia đình: Phương pháp ILP và Pure-Parsimony của luận án duy trì tuyệt đối các ràng buộc Mendel trên cả ba cá thể, triệt tiêu hoàn toàn tỷ lệ lỗi mâu thuẫn $8.02%$ của Acherman và $>25%$ của Halperin.
3. Phát hiện bất ngờ nhất với bằng chứng dữ liệu hỗ trợ là gì?
Phát hiện bất ngờ nhất là Sự tồn tại của các tổ hợp Đa SNP liên kết bệnh Crohn có ý nghĩa thống kê cao ($p < 0.05$ sau hiệu chỉnh đa biến) trong khi toàn bộ các SNP thành phần khi xét đơn lẻ đều hoàn toàn không có ý nghĩa thống kê. Điều này chứng minh rằng cơ chế bệnh học của bệnh Crohn trên vùng 5q31 bị chi phối bởi hiện tượng tương tác phi tuyến (Epistasis), bác bỏ giả thuyết đơn gen truyền thống. Thêm vào đó, thực nghiệm kiểm định hoán vị Monte-Carlo xác nhận tỷ lệ dự đoán rơi từ $75.38%$ về đúng $50.0%$, chứng minh độ chính xác đạt được không phải do hiện tượng quá khớp (Overfitting).
4. Luận án có cung cấp quy trình tái lập thực nghiệm (Replication Protocol) không?
Có. Luận án mô tả chi tiết quy trình toán học, cấu trúc dữ liệu ma trận, các hàm mục tiêu của mô hình Quy hoạch Tuyến tính Nguyên (ILP), thuật toán giải mã đồ thị BFS, và mã giả hoàn chỉnh cho thuật toán 2SNP, MLR-tagging, SVM-tagging. Bộ sinh dữ liệu chuẩn ms (Hudson, 2002) được cung cấp với đầy đủ tham số dòng lệnh và các bộ dữ liệu thực tế (Daly et al., Ueda et al.) đều là các nguồn dữ liệu công khai tiêu chuẩn quốc tế.
5. Chương trình nghiên cứu 10 năm tiếp theo được định hình ra sao?
Chương trình nghiên cứu dài hạn tập trung vào 4 trục chính:
- Hoàn thiện các công thức toán học cho ước lượng không chệch trong bài toán hồi quy MLR-tagging.
- Mở rộng khung tối ưu tổ hợp sang lĩnh vực sinh học cấu trúc: dự đoán vị trí gắn kết cơ chất protein (AMMP binding sites).
- Mô phỏng động học hệ thống tế bào vi khuẩn ở mức độ phân tử dưới các điều kiện vi môi trường thay đổi.
- Mở rộng quy mô thuật toán nén và phân tích sang cấp độ toàn bộ hệ gen (Whole-Genome Sequencing Analysis).
Kết luận
Luận án tiến sĩ của Jingwu He đã hoàn thành xuất sắc sứ mệnh giải quyết các thách thức tính toán cốt lõi trong dịch tễ học di truyền với sáu đóng góp đột phá then chốt:
- Khung Quy giản Đại số Tuyến tính Tiên phong: Xây dựng hệ ký hiệu ${-1, 1, 0}$ và chứng minh điều kiện phân rã ma trận đồ thị không tầm thường, tăng tốc các công cụ phân pha haplotype chuẩn mực lên tới 60 lần.
- Định lý Hạng Tái tổ hợp Tuyến tính: Xác lập giới hạn trên chặt chẽ $\text{rank}(H) \le (g+1)(l-1)+1$, tái định hình nền tảng lý thuyết di truyền quần thể về cấu trúc không gian haplotype.
- Giải pháp Phân pha Bộ ba Gia đình Toàn diện: Phát triển các thuật toán Quy hoạch Tuyến tính Nguyên (ILP) và Tham lam triệt tiêu hoàn toàn các lỗi mâu thuẫn phả hệ mà các phần mềm thống kê quốc tế mắc phải.
- Đột phá Công nghệ Nén và Tagging SNP: Thiết lập phương pháp
MLR-taggingvàSVM-tagging, cho phép chỉ cần 0.4% Tag SNPs để tái cấu trúc toàn bộ chuỗi di truyền dài >25.000 SNPs với độ chính xác $98%$. - Khung Phân tích Tổ hợp Đa Locus cho Bệnh Phức tạp: Phát hiện thành công các tổ hợp Multi-SNP liên kết bệnh Crohn ($p < 0.05$) mà các mô hình đơn gen bất lực.
- Mô hình Dự đoán Tính Nhạy cảm Bệnh Tối ưu: Đạt độ chính xác dự đoán 77.38% (duy trì 75.38% ở khoảng tin cậy 95% Bootstrapping) trên bệnh Crohn, được kiểm chứng chặt chẽ qua thử nghiệm Monte-Carlo.
Nghiên cứu đã mở ra ba dòng chảy học thuật mới: Tối ưu hóa tổ hợp đại số trong hệ gen học, Học máy thống kê trong nén dữ liệu y sinh, và Khung phân tích tương tác gen phi Mendel. Di sản của luận án là nền tảng phương pháp luận vững chắc, thúc đẩy mạnh mẽ cuộc cách mạng y học chính xác và dịch tễ học tính toán trên phạm vi toàn cầu.
Trích đoạn nội dung luận án
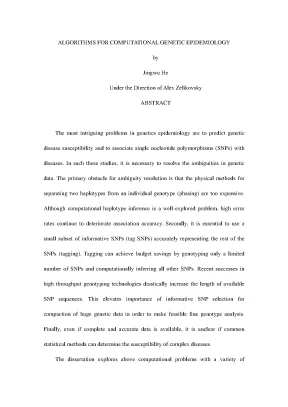
Tải xuống để đọc toàn bộALGORITHMS FOR COMPUTATIONAL GENETIC EPIDEMIOLOGY by Jingwu He Under the Direction of Alex Zelikovsky ABSTRACT The most intriguing problems in genetics epidemiology are to predict genetic disease susceptibility and to associate single nucleotide polymorphisms (SNPs) with diseases. In such these studies, it is necessary to resolve the ambiguities in genetic data. The primary obstacle for ambiguity resolution is that the physical methods for separating two haplotypes from an individual genotype (phasing) are too expensive. Although computational haplotype inference is a well-explored problem, high error rates continue to deteriorate association accuracy.
Secondly, it is essential to use a small subset of informative SNPs (tag SNPs) accurately representing the rest of the SNPs (tagging). Tagging can achieve budget savings by genotyping only a limited number of SNPs and computationally inferring all other SNPs. Recent successes in high throughput genotyping technologies drastically increase the length of available SNP sequences. This elevates importance of informative SNP selection for compaction of huge genetic data in order to make feasible fine genotype analysis.
Finally, even if complete and accurate data is available, it is unclear if common statistical methods can determine the susceptibility of complex diseases. The dissertation explores above computational problems with a variety of methods, including linear algebra, graph theory, linear programming, and greedy methods. The contributions include (1)significant speed-up of popular phasing tools without compromising their quality, (2)stat-of-the-art tagging tools applied to disease association, and (3)graph-based method for disease tagging and predicting disease susceptibility. INDEX WORDS: Tagging, Phasing, Haplotype, Genotype, SNP, Disease association, Susceptibility prediction ALGORITHMS FOR COMPUTATIONAL GENETIC EPIDEMIOLOGY by Jingwu He A Dissertation Submitted in Partial Fulfillment of Requirements for the Degree of Doctor of Philosophy in the College of Arts and Sciences Georgia State University 2006 UMI Number: 3243235 Copyright 2006 by He, Jingwu All rights reserved.
UMI Microform 3243235 Copyright 2007 by ProQuest Information and Learning Company. All rights reserved. This microform edition is protected against unauthorized copying under Title 17, United States Code. ProQuest Information and Learning Company 300 North Zeeb Road P.
Box 1346 Ann Arbor, MI 48106-1346 Copyright by Jingwu He 2006 ALGORITHMS FOR COMPUTATIONAL GENETIC EPIDEMIOLOGY by Jingwu He Major Professor: Alex Zelikovsky Committee: Yi Pan Anu Bourgeois Ion Mandoiu Electronic Version Approved: Office of Graduate Studies College of Arts and Sciences Georgia State University December 2006 DEDICATION To my dear daughter, Jennifer, my wife, Jun and my parents iv ACKNOWLEDGMENTS First, I would like to thank my advisor, Dr. Alexander Zelikovsky for advising and guide for my Ph. Secondly, I want to thank my dissertation committee members, Dr. Yi Pan, Dr.
Anu Bourgeois and Dr. I also appreciate support and assistance from our research group: Dumitru Brinza, Kelly Westbrooks, Weidong Mao and Nisar Hundewale. Finally, I want to thank my family and friends for their support and beliefs. v TABLE OF CONTENTS Page DEDICATION.
v LIST OF TABLES. ix LIST OF FIGURES .1 Road Map and Contributions. BIOLOGY BACKGROUND: SNPS, HAPLOTYPES, GENOTYPES, AND NOTATIONS. HAPLOTYPE INFERENCE PROBLEM .1 Population Haplotype Inference Problem .1 Previous Work and Problem Formulation .2 Linear Dependence of Sites, Haplotypes and Genotypes .3 Implementation of Linear Reduction Based on Matrix Multiplication .4 Fixing Caveats in Linear Reduction Approach .2 Phasing and Missing data recovery in Family Trios .1 Previous Work and Problem Formulation .2 Pure-Parsimony Trio Phasing .3 Integer Linear Program for Trio Phasing .4 Greedy Method for Trio Phasing.
INFORMATIVE SNP SELECTION .2 Linear Algebraic Method .1 Linear Algebraic Tagging .2 Linear Algebraic Tagging with Prescribed Number of Tags .3 Tag SNP Selection and SNP Prediction Problems .4 Multiple Linear Regression SNP Prediction Method .1 Introduction to Multiple Linear Regression .2 The MLR SNP Prediction Algorithm .3 Running Time of MLR SNP prediction and Tag Selection .5 MLR-tagging Software .5 Support Vector Machine SNP Prediction Method .2 SVM Haplotype Tagging .4 SVM-tagging Software .6 Application of Tagging to Disease Association Search .1 Multi-SNP to Disease Association .3 Searching Methods for Disease Association. DISEASE SUSCEPTIBILITY PREDICTION .3 Measures of Prediction Quality and Cross-validation Methods .2 Reduction to Set Covering Problem .3 Set Covering Greedy Algorithm .3 Prediction Algorithms for Disease Susceptibility .2 Graph-based Prediction Methods. CONCLUSION AND FUTURE WORK .1 Unbiased Estimates of MLR Tagging .2 Protein substrate prediction .3 Simulation of behavior of bacterial cells under specific growth conditions. 118 viii LIST OF TABLES Table Page 3.1 The comparison of the running times of DPPH and Linearly Reduced DPPH.
Each value is averaged over 100 datasets. E and D is the CPU time for encoding and decoding and RD is DPPH runtime for the reduced instance.2 The comparison of the running times of PHASE and Linearly Reduced PHASE. Each value is averaged over 25 datasets.3 The comparison of the quality of haplotyping of Linearly Reduced PHASE (LRP) and PHASE (P) vs the original haplotypes (O). Here the difference in haplotype data sets, Hapset1/Hapset2 is the arithmetic mean of numbers of false-positive and false-negative haplotypes over the number of haplotypes Hapset2 times 100%.
Each value is averaged over 25 datasets.4 The comparison of the quality of haplotyping of Linearly Reduced PHASE (LRP) and PHASE (P) vs the original haplotypes (O). Here the difference in haplotype data sets, Hapset1/Hapset2 is the arithmetic mean of numbers of false-positive and false-negative haplotypes over the number of haplotypes Hapset2 times 100%. Each value is averaged over feasible graphs among 25 datasets.5 The comparison of the running times of HAPLOTYPER and Linearly Reduced HAPLOTYPER. Each value is averaged over 25 datasets.6 The comparison of the quality of haplotyping of Linearly Reduced HAPLOTYPER (LRH) and HAPLOTYPER (H) vs the original haplotypes (O).
Here the difference in haplotype data sets, Hapset1/Hapset2 is the arithmetic mean of numbers of false-positive and false-negative haplotypes over the number of haplotypes Hapset2 times 100%. Each value is averaged over feasible graphs among 25 datasets.7 The comparison of the quality of haplotyping of Linearly Reduced HAPLOTYPER (LRH) and HAPLOTYPER (H) vs the original haplotypes (O). Here the difference in haplotype data sets, Hapset1/Hapset2 is the arithmetic mean of numbers of false-positive and false-negative haplotypes over the number of haplotypes Hapset2 times 100%. Each value is averaged over feasible graphs among 25 datasets.8 The comparison of the running times on real data.9 The comparison of Linearly Reduced HAPLOTYPER (LRH), HAPLOTYPER(H), Linearly Reduced PHASE (LRP), PHASE (P), and original haplotypes (O) on biological data.10 The results for three phasing methods on the real data sets [26, 32, 54] and simulated data set.
Error% is the percent sites where (best choice of) paternal and maternal haplotypes disagree with the offspring genotype. D % is the Hamming distance between the phased haplotypes and the closest feasible haplotypes.11 The comparison of the running times, number of variables, number of constraints of three linear programs. Each value is averaged over all blocks. All phasing block sizes are uniform.12 The results for five phasing methods on the real data sets of Daly et al.[26], Gabrile et al.
[32] and on simulated data. The second column corresponds to the ratio of erased data. The C corresponds to the logical error of child. The P corresponds to the logical error of parents.
The T corresponds to the total logical error.13 The results for five phasing methods on the simulated data sets. The column E represents the percent of erased data. The C corresponds to the true error of child. The P corresponds to the true error of parents.
The T corresponds to the true total error.14 The results for missing data recovery on the real and simulated data sets with five methods. The second column corresponds to the ratio of erased data. The C* corresponds to the error of child. The P* corresponds to the error of parents.
The T* corresponds to the total error.1 The quality of SNP prediction from the given number of tags (5% to 15% of the total number of SNPs (in Parentheses). The prediction quality is measured by the prediction accuracy and the average and minimum R2. Total number of SNPs in each dataset is in the parenthesis.2 Number of tags used by MLR-tagging, STAMPA and LR to achieve 80% and 90% prediction accuracy in leave-one-out tests.3 The comparison of MLR’s and STAMPA’s prediction accuracy and running time by using the number of tags (2, 5, 10, 15, 20, 25) on region ENr123 (A) and ENm010 (B) from 2 population: Han Chinese (HCB) and Japanese (JRT). Total number of SNPs in each dataset is in the parenthesis.4 The quality of MLR/STA on Daly et al.
[26] data with two different tagging objectives over different number of tag SNPs.5 The number of tag SNPs for statistical covering of all SNPs required by three methods: MLR/STA with prediction objective, MLR/STA with statistical covering objective, and IdSelect [16].6 Leave-one-out tests are performed on 3 real haplotype datasets. The minimum number of tag SNPs needed to reach from 80% to 99% prediction accuracy is listed. The bold numbers indicate cases when the SVM/STA needs fewer tags than the MLR method of He et al. [45] for reaching same prediction accuracy.7 The comparison of our proposed SVM/STA method and the MLR method of He et al.
[45] over different number of tag SNPs.8 Comparison of four methods for searching disease-associated multi-SNPs combinations.1 Classification contingency table .2 The comparison of the prediction rates of 6 prediction methods for Crohn’s Disease (Daly et al.)[26] and autoimmune disorder (Ueda et al. Genotype data are phased by 4 methods. GERBIL [37]and PHASE [87] are statistical tools for haplotype reconstruction. For Crohn’s Disease, GERBIL feasible and PHASE feasible find the respective closest feasible haplotypes of the trio data.3 The comparison of the prediction rates of two prediction methods (Second Neighbor and Haplotype Weighting) on Daly et al.
[26] phased by GERBIL [37] and GERBIL Feasible. We report bootstrapping rates, i., the 5th worst rate out of 100 runs (95% confidence) and different bootstrapping rates – averaged over 100 random choices of 20 case and 200 control genotypes. 107 xii LIST OF FIGURES Figure Page 1.1 DNA, gene, chromosome, genome .1 An example of Haplotype Inference Problem .2 2SNP Phasing Algorithm .3 An graph representation of Haplotype Inference Problem .4 The Decoding Algorithm.5 (a) The reduced haplotype graph with 3 vertices.6 Resolve child’s haplotypes .1 Problem formulation of Informative SNP Selection .2 Simulated data with 25000 sites and haplotype population 1000. The total number of errors in % to the total number of SNPs depending on the size of the sample population for the three algorithms LR, RLR, RLRP and 3RLRP.3 The dataset of 158 haplotypes with 103 SNPs from [26].
The total number of errors in % to the total number of SNPs depending on the size of the sample population for the three algorithms LR, RLR, RLRP and 3RLRP.4 The dataset of 158 haplotypes with 103 SNPs from [26]. The total number of errors in % to the total number of SNPs depending on the number of the tags for algorithms RLRP and 3RLRP.5 Simulated data with 25000 sites and different sizes of haplotype population. The total number of errors in % to the total number of SNPs depending on the size of the sample population for the different population sizes (p = 300, 500, 1000, 2000).6 The x-axis shows the number of zeros in each column of R of the haplotype matrix and the y-axis shows reconstruction error rate for each column in the sample using the RLRP method.7 (A) The total number of errors as a percentage of the total number of SNPs depending on the size of the sample population for the three algorithms LRP, RLRP, and SLT on Chromosome 5q31. (B) The total number of errors as a percentage of total number of SNPs depending on the size of the sample population and the percentage of missing data for the SLT method on Chromosome 5q31.8 The x-axis shows the number of tag SNPs, and the y-axis shows the fraction of SNPs correctly imputed in a leave-one-out experiment.
Nội dung được bảo vệ bản quyền — Tải xuống đầy đủ
Trích dẫn luận án này
Jingwu He (2006). Thuật toán tính toán cho dịch tễ học di truyền [Luận án tiến sĩ, Georgia State University]. LuanAn.net. https://luanan.net/y-te-cong-cong/dich-te-hoc/thuat-toan-tinh-toan-dich-te-hoc-di-truyen
Từ khóa và chủ đề nghiên cứu
Từ khóa liên quan
Xem thêm luận án cùng lĩnh vực
Chủ đề nghiên cứu
Câu hỏi thường gặp
Luận án "Thuật toán tính toán cho dịch tễ học di truyền" nghiên cứu về vấn đề gì?
Luận án tiến sĩ khám phá thuật toán tính toán dịch tễ học di truyền. Đề xuất phương pháp tăng tốc phasing, công cụ tagging SNP và dự đoán bệnh di truyền.
Luận án "Thuật toán tính toán cho dịch tễ học di truyền" được bảo vệ tại trường nào?
Luận án này được bảo vệ tại Georgia State University. Năm bảo vệ: 2006.
Luận án "Thuật toán tính toán cho dịch tễ học di truyền" thuộc chuyên ngành gì?
Luận án "Thuật toán tính toán cho dịch tễ học di truyền" thuộc chuyên ngành Genetic Epidemiology. Danh mục: Dịch Tễ Học.
Luận án "Thuật toán tính toán cho dịch tễ học di truyền" có bao nhiêu trang?
Luận án "Thuật toán tính toán cho dịch tễ học di truyền" có 147 trang. Bạn có thể xem trước một phần tài liệu ngay trên trang web trước khi tải về.
Cách tải luận án "Thuật toán tính toán cho dịch tễ học di truyền" về máy như thế nào?
Để tải luận án về máy, bạn nhấn nút "Tải xuống ngay" trên trang này, sau đó hoàn tất thanh toán phí lưu trữ. File sẽ được tải xuống ngay sau khi thanh toán thành công. Hỗ trợ qua Zalo: 0559 297 239.