Coupling hydrodynamic and wave models for storm tide simulations - Yuji Funakoshi
Luận án tiến sĩ về mô hình thủy động lực và sóng mô phỏng triều cơn bão. Nghiên cứu Bão Floyd 1999 sử dụng mô hình ADCIRC và SWAN cho dự báo lũ lụt.
University of Central Florida
Civil and Environmental Engineering
Luan An
Luận án
Năm xuất bản
Số trang
236
Thời gian đọc
36 phút
Lượt xem
0
Lượt tải
0
Phí lưu trữ
50 Point
Mục lục chi tiết
Tóm tắt nội dung
I. Storm Tide Simulations Using Coupled Models
Storm tide simulations require sophisticated computational approaches. Researchers combine hydrodynamic and wave models to predict coastal flooding events. The coupling methodology integrates multiple physical processes occurring during hurricanes. This research focuses on Hurricane Floyd (1999) as a validation case study. The study demonstrates how wave-current interaction affects storm surge predictions. Advanced numerical models capture the complex dynamics of coastal inundation. The ADCIRC-2DDI model handles hydrodynamic calculations. The SWAN model processes wind-induced wave simulations. Together, these tools create comprehensive storm tide forecasts. The methodology applies to real-time forecasting systems. Coastal communities benefit from improved flood prediction accuracy. The research establishes protocols for operational weather services.
1.1. Integration of ADCIRC Hydrodynamic Model
The ADCIRC-2DDI model solves shallow water equations using finite element methods. This depth-integrated approach captures tidal dynamics and storm surge development. The model processes astronomical tides as primary forcing mechanisms. Tributary inflows contribute to water level variations. Meteorological effects include wind stress and atmospheric pressure gradients. The generalized wave continuity form ensures numerical stability. The model domain spans the East Coast, Gulf of Mexico, and Caribbean Sea. Special refinement focuses on the St. Johns River area. This comprehensive coverage enables accurate boundary condition specification.
1.2. SWAN Spectral Wave Model Implementation
SWAN represents third-generation spectral wave models for coastal applications. The wave action balance equation governs wave evolution processes. Wind forcing drives wave generation and growth. Sea surface elevations modify wave propagation patterns. Current conditions affect wave refraction and shoaling. The model estimates wave parameters in estuaries and nearshore zones. Wave radiation stress calculations feed into hydrodynamic simulations. This output creates the foundation for model coupling procedures.
1.3. Model Domain Development Strategy
Domain construction follows a multi-scale approach. Large-scale coverage ensures proper offshore boundary conditions. Local refinement captures riverine and estuarine details. The St. Johns River receives particular attention due to flooding concerns. Bathymetric data integration ensures accurate depth representation. Grid resolution varies based on geometric complexity. Coastal areas demand finer mesh spacing. Deep ocean regions utilize coarser elements for computational efficiency.
II. Wave Current Interaction in Coastal Flooding
Wave-current interaction significantly influences storm surge predictions. The coupling process captures radiation stress effects on water levels. Uni-directional coupling represents a simplified approach. Full coupling describes complete physical interactions between processes. Research demonstrates 10-15% higher peak storm tides when including wave effects. The interaction modifies both surge magnitude and temporal distribution. Wave radiation stresses alter momentum balance in shallow water equations. Current fields affect wave propagation and energy dissipation. This feedback mechanism proves critical during hurricane conditions. Coastal inundation patterns change when wave effects are incorporated. The methodology improves numerical weather prediction accuracy. Operational forecasting systems require these enhanced capabilities.
2.1. Uni Directional Coupling Methodology
Uni-directional coupling transfers SWAN output to ADCIRC simulations. Wave radiation stress gradients modify momentum equations. The process occurs without feedback from hydrodynamics to waves. This simplified approach reduces computational demands. Results show substantial improvements over uncoupled simulations. Peak water levels increase by 10-15% during storm events. The methodology provides a practical option for operational forecasting. Implementation requires careful timing of data transfer between models.
2.2. Full Coupling Implementation Techniques
Full coupling enables bidirectional information exchange. ADCIRC provides water levels and currents to SWAN. SWAN returns updated wave radiation stresses to ADCIRC. The iteration continues throughout the simulation period. This approach captures complete wave-current interaction physics. Storm tide hydrographs show modified peak timing and magnitude. Peaks decrease while troughs increase compared to uni-coupling. The interaction smooths water level variations. Computational costs rise due to iterative exchanges. Accuracy improvements justify the additional processing requirements.
2.3. Radiation Stress Effects on Storm Surge
Wave radiation stresses represent momentum flux from waves to currents. Breaking waves generate setup in the nearshore zone. This setup adds to astronomical tides and meteorological surge. The combined effect produces total storm tide levels. Radiation stress gradients drive additional water transport. Coastal flooding predictions improve when these effects are included. The mechanism proves especially important during hurricane landfall. Shallow water regions experience the strongest radiation stress impacts.
III. Hurricane Floyd Storm Surge Modeling Results
Hurricane Floyd (1999) serves as the primary validation case. The storm impacted the East Coast with significant flooding. Model calibration follows a three-step verification process. Astronomical tide simulations validate against NOS tide gauge data. Riverine flows and meteorological forcing are then incorporated. Final validation compares simulated storm tides with historical measurements. The St. Johns River experienced substantial water level rises. Model results demonstrate strong agreement with observed data. Coupled simulations outperform uncoupled approaches. The research establishes confidence in the modeling framework. Results support operational implementation for real-time forecasting. The methodology applies to future hurricane events.
3.1. Three Step Calibration Process
Calibration begins with astronomical tide validation. Harmonic constituents are adjusted to match NOS observations. Tidal phase and amplitude receive careful attention. Next, tributary inflows and meteorological effects are added. Wind stress and atmospheric pressure modify water levels. River discharge contributes to overall water balance. Finally, complete storm tide simulations incorporate all forcings. Each step builds confidence in model performance. The systematic approach isolates error sources effectively.
3.2. Comparison with Historical Data
NOS tide gauge stations provide validation benchmarks. Water level time series show strong correlation with simulations. Peak storm tide timing matches observations closely. Magnitude differences remain within acceptable error bounds. The coupled model reduces prediction errors significantly. Statistical metrics quantify performance improvements. Root mean square errors decrease when wave effects are included. The validation supports operational deployment of the modeling system.
3.3. St. Johns River Flooding Analysis
The St. Johns River presents unique modeling challenges. Riverine and coastal processes interact throughout the system. Upstream flows meet ocean surge propagating inland. Wind forcing on the river surface adds complexity. Model results capture these competing influences. Water levels inside the river depend on deep ocean wind forcing. Local wind effects superimpose on larger-scale patterns. The analysis reveals dominant forcing mechanisms for different river reaches.
IV. Forcing Mechanisms in Tidal and Storm Dynamics
Multiple forcing mechanisms drive water level variations. Astronomical tides provide the baseline oscillation. Meteorological effects modify this tidal signal. Wind stress represents the dominant storm forcing. Atmospheric pressure variations contribute secondary effects. Tributary inflows add freshwater volume to the system. Wave radiation stresses enhance total water levels. A 122-day hindcast quantifies relative forcing importance. Wind forcing equals or exceeds astronomical tides in the St. Johns River. Pressure variations show minimal impact on water levels. Inflows generally have less influence than wind effects. Deep ocean wind forcing controls river water levels. The analysis guides model simplification decisions. Understanding forcing hierarchy improves forecast efficiency.
4.1. Wind Stress Dominance Analysis
Wind stress emerges as the primary storm forcing mechanism. Surface drag transfers atmospheric momentum to water. The effect scales with wind speed squared. Hurricane-force winds generate extreme water level responses. The St. Johns River shows particular sensitivity to wind direction. Northeasterly winds produce maximum setup conditions. Southwesterly winds cause setdown and drainage. The 122-day hindcast confirms wind dominance over other forcings. Operational forecasts must prioritize accurate wind field specification.
4.2. Atmospheric Pressure Effects
Atmospheric pressure variations create inverse barometer effects. Low pressure allows sea surface elevation increase. The response approximates 1 cm per millibar pressure drop. Hurricane pressure deficits reach 50-100 millibars. Resulting setup contributes 0.5-1.0 meters to storm surge. However, wind effects typically dominate pressure contributions. The St. Johns River shows minimal pressure sensitivity. Local bathymetry and geometry influence pressure response magnitude.
4.3. Tributary Inflow Contributions
Tributary inflows add freshwater volume continuously. Normal discharge maintains baseline river levels. Storm rainfall increases inflow rates substantially. The combined effect raises water levels throughout the system. However, wind forcing generally supersedes inflow impacts. The relative importance varies with storm characteristics. Slow-moving systems with heavy rainfall emphasize inflow effects. Fast-moving hurricanes emphasize wind and wave contributions. Model configurations must include both mechanisms for complete accuracy.
V. Operational Forecasting System Applications
The research creates a prototype for real-time forecasting. National Weather Service offices benefit from enhanced capabilities. Flash flood warnings require rapid water level predictions. River stage forecasts support emergency management decisions. The coupled modeling approach improves prediction accuracy. Computational efficiency enables operational implementation. Model domains support nested configuration strategies. Large-scale domains provide offshore boundary conditions. Local-scale domains resolve detailed flooding patterns. Elevation hydrograph boundary conditions transfer information between scales. This approach maintains accuracy while reducing computational costs. Forecasting centers in coastal areas gain critical tools. The methodology applies to Atlantic and Gulf Coast regions.
5.1. Real Time Simulation Requirements
Operational forecasting demands rapid execution times. Computational efficiency determines practical applicability. Model domains require optimization for speed and accuracy. Parallel processing capabilities accelerate calculations. Automated data ingestion systems feed current conditions. Meteorological inputs come from numerical weather prediction models. Boundary conditions update as forecasts evolve. The system must complete runs within operational time windows. Results must reach forecasters before critical decision points.
5.2. Multi Scale Domain Strategy
Large-scale domains capture regional ocean circulation. Coverage includes the entire East Coast and Gulf of Mexico. Coarse resolution reduces computational burden. Boundary conditions avoid artificial constraints. Local-scale domains focus on specific river systems. Fine resolution captures detailed bathymetry and topography. The St. Johns River domain demonstrates this approach. Elevation hydrographs transfer from large to local scales. Results show high accuracy despite domain separation. The strategy enables efficient operational forecasting.
5.3. Integration with NWS Forecasting Centers
National Weather Service offices require specialized tools. River Forecast Centers monitor inland flooding. Weather Forecast Offices issue coastal flood warnings. The coupled modeling system serves both functions. Storm surge predictions support evacuation decisions. River stage forecasts guide flood fighting efforts. The prototype demonstrates operational feasibility. Implementation requires training and technical support. Ongoing validation ensures continued forecast quality. The system represents a significant advancement in coastal flooding prediction.
VI. Model Performance and Key Findings Summary
Research conclusions highlight coupling benefits and forcing insights. Wave effects increase peak storm tides by 10-15% regardless of coupling type. This finding applies to both uni-directional and full coupling approaches. Wave-current interaction modifies hydrograph shape significantly. Coupled models show decreased peaks and increased troughs. The smoothing effect results from momentum exchange between waves and currents. Wind forcing dominates water level variations in the St. Johns River. This dominance equals or exceeds astronomical tide contributions. Tributary inflows generally have less impact than wind stress. Atmospheric pressure variations show minimal influence. Deep ocean wind forcing controls river water levels through surge propagation. Boundary condition specification proves critical for local-scale models. Elevation hydrographs from large-scale domains enable accurate local predictions. The methodology supports operational implementation for coastal flooding prediction.
6.1. Wave Coupling Impact Quantification
Coupled simulations consistently show 10-15% higher peaks. This increase applies across different storm intensities. The effect results from wave radiation stress contributions. Breaking waves generate additional setup in shallow water. The magnitude depends on wave height and period. Coastal geometry influences radiation stress distribution. Both uni-coupling and full coupling produce similar peak increases. However, full coupling better captures temporal variations. The finding demonstrates wave effects cannot be ignored in storm surge modeling.
6.2. Hydrograph Shape Modifications
Full coupling creates distinct hydrograph changes. Peak water levels decrease slightly compared to uni-coupling. Trough levels increase during the same periods. The overall effect smooths temporal variations. Wave-current interaction drives this behavior. Currents modify wave propagation and breaking patterns. Waves alter current velocity distributions. The feedback mechanism redistributes momentum and energy. Forecasters must understand these shape changes for accurate interpretation.
6.3. Forcing Hierarchy for River Systems
The 122-day hindcast reveals forcing importance rankings. Wind stress dominates all other mechanisms. Astronomical tides provide secondary contributions. Tributary inflows rank third in most conditions. Atmospheric pressure shows minimal impact. Deep ocean wind forcing propagates into riverine reaches. Local wind effects superimpose on this base signal. The hierarchy guides model simplification for operational use. Critical forcings require accurate specification. Lesser forcings may use simplified representations without significant accuracy loss.
Tải xuống file đầy đủ để xem toàn bộ nội dung
Tải đầy đủ (236 trang)Trích đoạn nội dung luận án
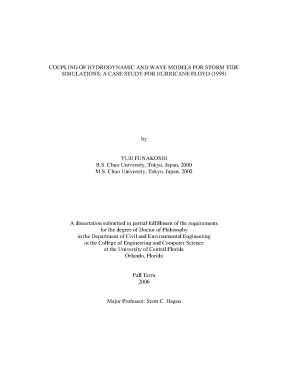
Tải xuống để đọc toàn bộCOUPLING OF HYDRODYNAMIC AND WAVE MODELS FOR STORM TIDE SIMULATIONS: A CASE STUDY FOR HURRICANE FLOYD (1999) by YUJI FUNAKOSHI B. Chuo University, Tokyo, Japan, 2000 M. Chuo University, Tokyo, Japan, 2002 A dissertation submitted in partial fulfillment of the requirements for the degree of Doctor of Philosophy in the Department of Civil and Environmental Engineering in the College of Engineering and Computer Science at the University of Central Florida Orlando, Florida Fall Term 2006 Major Professor: Scott C. Hagen UMI Number: 3242434 UMI Microform 3242434 Copyright 2007 by ProQuest Information and Learning Company.
All rights reserved. This microform edition is protected against unauthorized copying under Title 17, United States Code. ProQuest Information and Learning Company 300 North Zeeb Road P. Box 1346 Ann Arbor, MI 48106-1346 © 2006 Yuji Funakoshi ii ABSTRACT This dissertation presents the development of a two-dimensional St.
Johns River model and the coupling of hydrodynamic and wave models for the simulation of storm tides. The hydrodynamic model employed for calculating tides and surges is ADCIRC-2DDI (ADvanced CIRCulation Model for Shelves, Coasts and Estuaries, Two-Dimensional Depth Integrated) developed by Luettich et al. The finite element based model solves the fully nonlinear shallow water equations in the generalized wave continuity form. Hydrodynamic applications are operated with the following forcings: 1) astronomical tides, 2) inflows from tributaries, 3) meteorological effects (winds and pressure), and 4) waves (wind-induced waves).
The wave model applied for wind-induced wave simulation is the third-generation SWAN (Simulating WAves Nearshore), applicable to the estimation of wave parameters in coastal areas and estuaries. The SWAN model is governed by the wave action balance equation driven by wind, sea surface elevations and current conditions (Holthuijsen et al. The overall work is comprised of three major phases: 1) To develop a model domain that incorporates the entire East Coast of the United States, Gulf of Mexico and Caribbean Sea, while honing in on the St. Johns River area; 2) To employ output from the SWAN model with the ADCIRC model and produce a uni-directional coupling of the two models in order to investigate the effects of the wave radiation stresses; 3) To couple the ADCIRC model with the SWAN model to describe the complete interactions of the two physical processes.
iii Model calibration and comparisons are accomplished in three steps. First, astronomical tide simulation results are calibrated with historical NOS (National Ocean Service) tide data. Second, overland and riverine flows and meteorological effects are included, and computed river levels are compared with the historical NOS water level data. Finally, the storm tides generated by Hurricane Floyd are simulated and compared with historical data.
This research results in a prototype for real-time simulation of tides and waves for flash flood and river-stage forecasting efforts of the NWS Forecasting Centers that border coastal areas. The following two main conclusions are reported: 1) regardless of whether one uses uni-coupling or coupling, wind-induced waves result in an approximately 10 – 15 % higher peak storm tide level than without any coupling; and 2) the wave-current interaction described by the coupling model results in decreasing peaks and increasing troughs in the storm tide hydrograph. Two main corollary conclusions are also drawn from a 122-day hindcast for the period spanning June 1 – October 1, 2005. First, wind forcing for the St.
Johns River is equal to or greater than that of astronomic tides and generally supersedes the impact of inflows, while pressure variations have a minimal impact. Secondly, water levels inside the St. Johns River depend on the wind forcings in the deep ocean; however, if one applies an elevation hydrograph boundary condition from a large-scale domain model to a local-scale domain model the results are highly accurate. iv ACKNOWLEDGMENTS I would like to express my appreciation to those people whose assistance helped me finalize this research.
First, I would like to thank Dr. Hagen for his exceptional support and advice on this project as well as the many pleasant conversations I had with him during my stay at UCF. I also would like to thank Dr. Gour-Tsyh Yeh, Dr.
Necati Catbas, and Dr. Alain Kassab for agreeing to serve on my committee; Dr. Pedro Restrepo of NOAA/NWS/OHD and Ms. Reggina Cabrera of SERFC, for providing the vital information about the St.
Johns River; Dr. Sucsy of SJRWMD, for providing the bathymetric data associated with the St. Johns River; Andrew T. Cox of Oceanweather Inc., for providing the wind field information; R.
Jensen of USACE, for providing the wave field information; Peter Bacopoulos, for checking the English usage in this dissertation; and many thanks to both current and past lab members: Daniel Dietsche, Derek Giardino, David Coggin, Juliano Elias, Michael Parrish, Mike Salisbury, Ryan Murray, Satoshi Kojima, Naeko Takahashi, and Qing Wang. Last but not least, I am very grateful to have such a wonderful family in my life. This research was in part conducted under award NA04NWS4620013 from the National Oceanic and Atmospheric Administration (NOAA), U. Department of Commerce, and Award N00014- 02-1-0150 from the National Oceanographic Partnership Program (NOPP) administered by the Office of Naval Research (ONR).
The statements, findings, conclusions, and recommendations are those of the authors and do not necessarily reflect the views of NOAA, the Department of Commerce, ONR or NOPP and its affiliates. v TABLE OF CONTENTS LIST OF FIGURES. x LIST OF TABLES. xvii LIST OF ABBREVIATIONS.
xviii CHAPTER 1 INTRODUCTION .1 The Western North Atlantic Tidal (WNAT) Model Domain. 8 CHAPTER 2 WAVE MECHANICS AND DYNAMICS.1 The Basic Types of Ocean Waves .1 Statistical Treatment of Wind Waves .2 Generation of Wind Waves.4 The Governing Equation for Wind Waves and Swell .5 Tides and Tidal Currents.7 The Governing Equations for Tides and Storm Surges .1 The Depth-Integrated Equations. 32 CHAPTER 3 LITERATURE REVIEW .1 Coupling of Wave and Hydrodynamic Models .2 Coupling of Wave model and Atmospheric Models .3 Coupling of Hydrodynamic and Atmospheric Models.4 Ultimate Coupling Model and Discussion. 43 CHAPTER 4 MODEL DESCRIPTIONS.2 WAM and SWAN.1 Wave Radiation Stresses.3 Wind Field Model.1 Wind Stresses for ADCIRC-2DDI.2 Wind Stresses for WAM and SWAN.
60 CHAPTER 5 FINITE ELEMENT MESHES AND FINITE DIFFERENCE GRID DEVELOPMENT. Johns River Region.2 Finite Element Mesh Development .1 The Global-Scale ADCIRC Mesh (WNAT-SJR Mesh) .2 The Local-Scale ADCIRC Mesh (Pseudo-Operational Mesh) .3 Finite Difference Grid Development .1 The Global-Scale WAM Grid .2 The Local-Scale SWAN Grid .4 Coupling Model Domain. 77 CHAPTER 6 MODEL SETUP.1 The ADCIRC Model.1 Astronomical Tides Verification.2 River Inflow Verification.3 Hurricane Floyd Wind Frocing Verification.4 Coupling of the SWAN model for Hurricane Floyd Storm Tide Simulation .2 The SWAN Model .3 Model Output Locations. 82 CHAPTER 7 SIMULATION RESULTS .1 The ADCIRC Model Simulation .1 Astronomical Tide Verification .2 River Inflow Verification.3 Wind Forcings Verification and 122-day Simulation .4 Hydrograph Boundary Condition Verification .5 Hurricane Floyd Wind Forcings Verification .2 The Uni-Coupling Model Simulation .1 The Uni-Coupling Procedure .2 Wind-Induced Wave Verification.3 The Coupling Model Simulation .1 The Coupling Procedure .2 Wave-Current Interaction Verification .5 Creation of the Best Hydrograph.
138 CHAPTER 8 CONCLUSION AND FUTURE WORK. 145 APPENDIX A ADCIRC-2DDI INPUT FILE: MESH DESCRIPTION. 146 APPENDIX B ADCIRC-2DDI INPUT FILE: MODEL PARAMETER. 148 APPENDIX C SWAN INPUT FILE: MODEL PARAMETER.
153 APPENDIX D NUMERICAL SIMULATION RESULTS: THE ADCIRC RESULTS. 155 APPENDIX E NUMERICAL SIMULATION RESULTS: THE UNI-COUPLING AND COUPLING RESULTS. 192 LIST OF REFERENCES. 207 ix LIST OF FIGURES Figure 1.1: The WNAT model domain with boundary.3: Hurricane Floyd track September 6 to 18, 1999 (NOAA).4: Hurricane Floyd maximum wind speed (mph, blue line) and minimum pressure (mb, red line) September 8 to 17, 1999 (NOAA).1: Schematic distribution of wave energy in frequencies (Massel 1996).2: Energy spectrum of waves (Bowden 1983).3: Definition of a directional wave spectrum (Bowden 1983).4: Forces involved in the formation of a spring tide (PhysicalGeography.5: Forces involved in the formation of a neap tide (PhysicalGeography.1: A schematic of the storm tides (Graber et al.2: A schematic of one- and two-way coupling of wave and hydrodynamic models.3: A schematic of coupling of wave and atmospheric models.4: An image from the first ocean circulation/atmospheric coupling model (Manabe et al.5: A schematic of coupling of wave and hydrodynamic models.6: A schematic of coupling of wave, hydrodynamic, and atmospheric models.1: Hurricane Floyd wind field.
Johns River region. Johns River and major drainage basins (Sucsy and Morris 2002).3: Finite element mesh for the WNAT-SJR model.4: Bathymetry for the WNAT-SJR model.5: Finite element mesh and bathymetry for St.6: Finite element mesh and bathymetry for the St. Johns River: inset α .7: Finite element mesh and bathymetry for the St. Johns River: inset β .8: Finite element mesh and bathymetry for the St.
Johns River: inset γ .9: Finite element mesh and bathymetry for the St. Johns River: inset δ .10: Finite element mesh and bathymetry for the Pseudo-Operational model.11: Wave field of the WAM model and maximum significant wave height generated by Hurricane Floyd (1999).12: Finite difference grid for the SWAN domain.13: Bathymetry for the SWAN domain.14: Overlapped finite element mesh and finite difference grid and NOS tidal gauge stations.1: NOAA\NOS tidal gauge locations for the Florida Atlantic Coast and the St.1: Astronomical tide comparison at Mayport.2: Astronomical tide comparison at I-295 Bridge West End.3: Astronomical tide comparison at Wekala.4: a) USGS gauge and river inflow locations and b) a relationship between precipitation [in] and average wind speed [mph] at Sanford.5: River level comparison at Mayport.6: River level comparison at I-295 Bridge West End.7: River level comparison at Buffalo Bluff.8: a) The 2005 Atlantic storm tracks and timeline (Wikipedia) and b) precipitation [in] and average wind speed [mph] at Jacksonville during simulation period.9: River level comparison at Main Street Bridge.10: Water level comparison (September 1 through 15, 2005) at Mayport.11: Water level comparison (September 16 through 30, 2005) at Mayport.12: Water level comparison (September 1 through 15, 2005) at I-295 Bridge.13: Water level comparison (September 16 through 30, 2005) at I-295 Bridge.14: Water level comparison (September 1 through 15, 2005) at Buffalo Bluff.15: Water level comparison (September 16 through 30, 2005) at Buffalo Bluff.16: Water level comparison (September 1 through 15, 2005) at Mayport.17: Water level comparison (September 16 through 30, 2005) at Mayport.18: Water level comparison (September 1 through 15, 2005) at I-295 Bridge.19: Water level comparison (September 16 through 30, 2005) at I-295 Bridge.20: Water level comparison (September 1 through 15, 2005) at Buffalo Bluff.21: Water level comparison (September 16 through 30, 2005) at Buffalo Bluff.22: Water level comparison based on the wind forcings at Fernandina Beach.23: Water level comparison based on the wind forcings at Mayport.24: Water level comparison based on the wind forcings at St.25: Water level comparison based on the wind forcings at Wekala.26: Water level comparison applying two domain sizes and hydrograph boundary conditions at Mayport.27: Water level comparison with various bottom frictions at Mayport.28: Water level comparison with various bottom frictions at Fernandina Beach.29: Water level comparison with several drag coefficients at Mayport.30: Water level comparison with several drag coefficients at Wekala.31: A diagram of uni-coupling SWAN and ADCIRC models.32: Water level comparison in non- and uni-couplings at Fernandina Beach.33: Water level comparison in non- and uni-couplings at Mayport.34: Water level comparison in non- and uni-couplings at St.35: Nested SWAN domain.36: Water level comparison using different boundary conditions at Mayport.37: Water level comparison applying the different modes in SWAN at Mayport.38: The methodology of the coupling of SWAN and ADCIRC models.39: Water level comparison among three models at Fernandina Beach.40: Water level comparison among three models at Mayport.41: Water level comparison among three models at St.42: Water level comparison used several exchange times at Mayport.43: Water level comparison by applying the hydrograph BC at Mayport.44: Maximum storm tide counters with the coupling model around Mayport.45: Water level comparison in three hydrographs at Fernandina Beach.46: Water level comparison in three hydrographs at Mayport.47: Water level comparison in three hydrographs at St.1: Simulation results (1 – 3, 1-4) at WWTD Mayport Naval Station.
Nội dung được bảo vệ bản quyền — Tải xuống đầy đủ
Câu hỏi thường gặp
Luận án "Coupling hydrodynamic and wave models for storm tide simulations" nghiên cứu về vấn đề gì?
Luận án tiến sĩ về mô hình thủy động lực và sóng mô phỏng triều cơn bão. Nghiên cứu Bão Floyd 1999 sử dụng mô hình ADCIRC và SWAN cho dự báo lũ lụt.
Luận án "Coupling hydrodynamic and wave models for storm tide simulations" được bảo vệ tại trường nào?
Luận án này được bảo vệ tại University of Central Florida. Năm bảo vệ: 2006.
Luận án "Coupling hydrodynamic and wave models for storm tide simulations" thuộc chuyên ngành gì?
Luận án "Coupling hydrodynamic and wave models for storm tide simulations" thuộc chuyên ngành Civil and Environmental Engineering. Danh mục: Hải Dương Học.
Luận án "Coupling hydrodynamic and wave models for storm tide simulations" có bao nhiêu trang?
Luận án "Coupling hydrodynamic and wave models for storm tide simulations" có 236 trang. Bạn có thể xem trước một phần tài liệu ngay trên trang web trước khi tải về.
Cách tải luận án "Coupling hydrodynamic and wave models for storm tide simulations" về máy như thế nào?
Để tải luận án về máy, bạn nhấn nút "Tải xuống ngay" trên trang này, sau đó hoàn tất thanh toán phí lưu trữ. File sẽ được tải xuống ngay sau khi thanh toán thành công. Hỗ trợ qua Zalo: 0559 297 239.